Demystifying DataDog Metrics Pricing: 2026 Ultimate Guide

So, you’re trying to understand why your DataDog metrics bill is so high and you can’t figure it out? You’re not alone. DataDog pricing is one of the great mysteries of the universe. But in this post, we’ll go over how it works and try to make it as clear as possible.
The first part of the bill for infrastructure hosting is a fixed price per host. Each host will be around $20/month, depending on your plan. DataDog will calculate the average number of hosts per month for that purpose.
The second part of the bill is custom metrics. DataDog separates metrics into two categories: Standard metrics and Custom metrics. Standard metrics are generated by the DataDog Agent and are included in your infrastructure pricing. The only reason to optimize them is to reduce noise from equivalent metrics.
Custom metrics, on the other hand, are the metrics you create yourself, either manually in your code or through third-party libraries such as the OpenTelemetry SDK. These are billed based on the number of Indexed Custom Metrics (ICMs).
Every metric consists of a metric name and a set of tags such as host, country, user_id, and so on. The number of custom metrics is the number of unique combinations of those tags. This is usually called Cardinality, but in DataDog lingo it is called the “number of custom metrics”, which is not confusing at all.
The advertised price per Indexed Custom Metric (ICM) is about $0.05 / month. However, each infrastructure host includes a free allowance of 100–200 custom metrics (depending on your plan), so a simplified pricing formula looks something like this:
$Price/month = (#hosts * host_price) + (Total_ICMs - #hosts * included_ICMs) * $0.05
Large enterprise customers usually negotiate discounts, but because of how cardinality multiplies, even discounted costs can explode. For example, imagine someone adds both container_id and user_id as tags. If you have 1,000 containers and 20,000 users, that’s potentially 20 million unique tag combinations. At $0.05 per custom metric, that could reach $1 million per month for a single metric. In reality, the number will be lower because not every user interacts with every container, but it’s still easy to generate an enormous bill.
Viewing Costs
There are several places in the DataDog UI where you can inspect your custom metrics usage and determine which metrics are contributing to your bill.
One useful screen is Metrics → Volume.
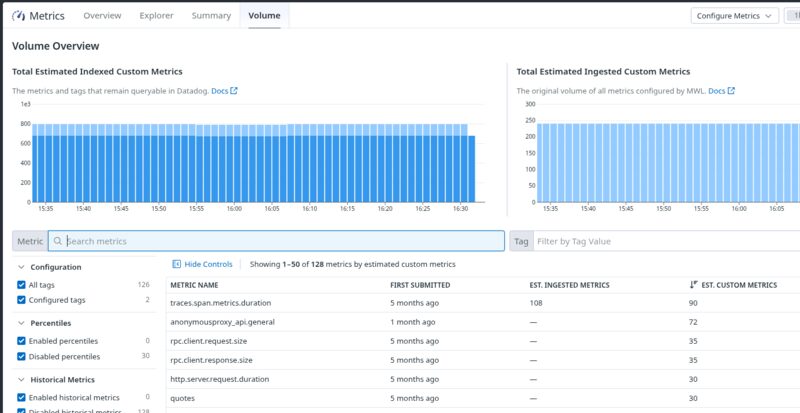
It provides a good overview that includes cardinality. Notice that some metrics show Estimated Ingested Metrics and Estimated Custom Metrics, while others show only Estimated Custom Metrics. That’s because some metrics are using Metrics without Limits, where ingestion and indexing are billed separately. We’ll discuss that shortly.
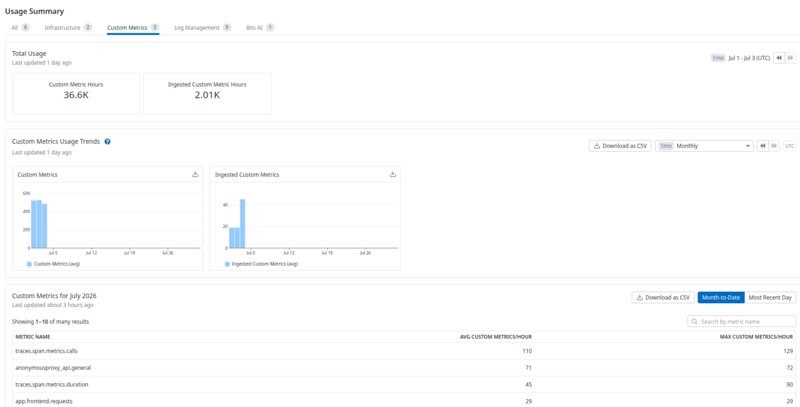
But the Volume page isn’t perfect for understanding billing because it represents only a snapshot in time. It can skew one way or the other, depending on the hour of the day. A better number is the average cardinality, which you can see in Billing → Usage → Custom Metrics. Here you’ll find the Average Custom Metrics/Hour and Maximum Custom Metrics/Hour.
Optimizing your Metrics Bill
There are only two ways to reduce your custom metrics bill:
- Remove metrics you don’t actually need.
- Reduce the cardinality of the metrics you keep.
Removing metrics can be surprisingly effective. Auto-instrumentation libraries such as the OpenTelemetry SDK expose hundreds of metrics by default, many of which overlap with metrics you’re already collecting. It’s common to find multiple equivalent metrics representing request counts, CPU utilization, memory usage, RPC durations, queue sizes, and similar concepts. If nobody is querying or alerting on them, you might as well remove them.
The biggest savings, however, almost always come from reducing cardinality.
Reducing Cardinality
The OpenTelemetry SDK is a major cardinality offender as well. With the best of intentions, it instruments metrics with a whole load of tags, like container names, CPU values, and what have you. Without oversight, it can easily bloat.
There are three ways you can reduce cardinality:
- At the source (best)
- In the OpenTelemetry Collector if you have one
- On the DataDog server side, using Metrics without Limits
Metrics without Limits lets you define either a whitelist or a blocklist of tags that should remain indexed. It can be accessed from the Metrics Summary or Metrics Volume pages by clicking on the “Manage Tags” button.
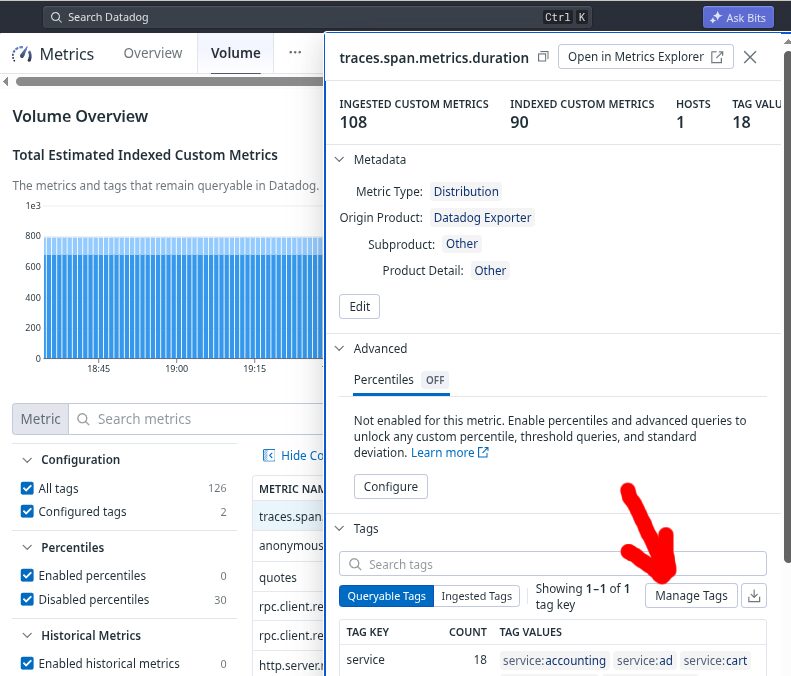
Once you enable this feature, pricing is split into two parts:
- Ingestion: charged for every metric with all of its original tags at a much smaller fee than indexing.
- Indexing: charged only for the tags that remain after your whitelist or blocklist rules are applied.
This can significantly reduce your indexed custom metrics while still preserving the raw data for future re-indexing if your needs change.
However, you’re still paying the ingestion cost, so the best optimization is to avoid sending it in the first place.
Optimizing at the Source
If your custom metric is something you added manually to the code, that’s the absolute best place to remove unnecessary tags.
If it was generated by a third-party library or service, that service might have configuration that allows to adjust sent metrics.
An OTEL Collector, is pretty flexible and can filter out or even bin metric tags with attributes and transform processors. If you’re using an OTEL Collector as a telemetry proxy, then using it to filter tags is the best option after editing in the source code.
As a general rule, only attach tags that someone is likely to filter, group by, or alert on. Tags like user_id, session_id, request_id, container_id, or UUIDs often explode cardinality while providing very little value for metrics. Those kinds of identifiers are usually much better suited for logs or traces.
Metrics Whack-a-Mole
The real challenge is finding redundancies and cardinality spikes before your bill reaches unreasonable levels.
Unfortunately, this is where DataDog offers little help. There are no sophisticated alerts that warn you when a metric’s cardinality suddenly explodes, no anomaly detection focused on custom metrics costs, and no built-in analysis that scans your dashboards and monitors to determine which tags are used and which aren’t. A cynical person—which I am not—might say DataDog is doing this on purpose.
That’s where Obics comes in. It alerts you to new spikes and proactively analyzes your system. Obics looks at your dashboards, monitors, and notebooks to identify tags or whole metrics that can safely be removed. Your charges become transparent, and reducing the bill becomes a quick task rather than a multi-month project. Request a free trial here.