By: Ron Miller | Published: May 5, 2025
Implementing an OpenTelemetry Collector in .NET
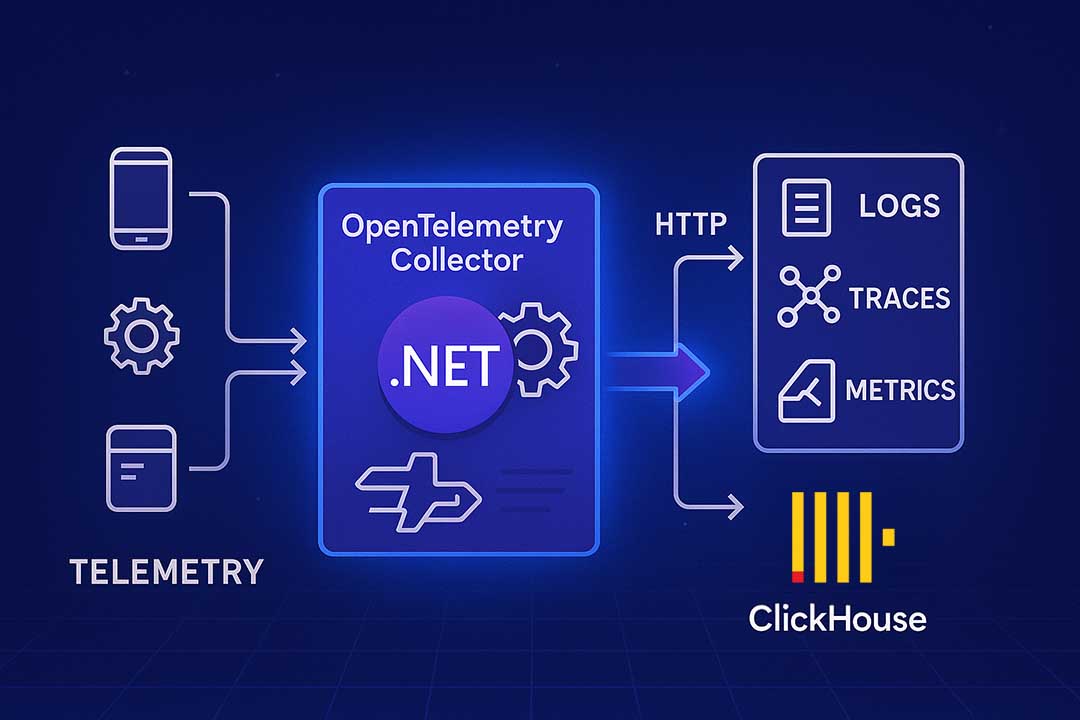
As an observability vendor, Obics receives data using the OpenTelemetry protocol. To implement an OTEL server—aka a collector—we made an unconventional choice: using .NET. In this article, I’ll tell you why we chose .NET, how we implemented it, and how it all went.
Let’s start with the why. Our requirements for the language/runtime were to be:
- Highly performant
- Mainstream
- Multi-threaded
- High-level (without memory management)
Why highly performant? The OTEL collector is a hot path for all telemetry received. The #1 requirement for it, besides availability, is low latency and high throughput. We want each machine to ingest as much as possible, and to do it as quickly as possible.
Why a mainstream language? There are a lot of advantages to popularity. It’s easier to hire engineers with experience. There are more forums, StackOverflow questions, and blog posts. Maybe most importantly, there are more training sources for AI, which means LLMs will be smarter about it.
Why multi-threaded? We wanted to have an in-memory cache for as many requests as possible. ClickHouse works best when ingesting large batches of rows—tens of thousands or even millions in a batch. If a single machine can receive more requests per second, then we can send a bigger batch at each interval (as opposed to more machines with smaller batches from each). More threads meant we could receive more requests on one machine. We figured that a big-enough in-memory cache meant we could avoid having to use a middleware service like Kafka. Not that Kafka is bad, but no component means no additional latency, complexity, or cost.
Why a high-level language? It’s a trade-off between productivity and performance. We chose productivity—at least for right now. Might be that in the future we’ll want to rewrite everything in Rust or something.
That minimized the choices to:
- Go
- C#
- Java
- Scala
- Kotlin
We chose C#. It’s a highly performant, mainstream, multi-threaded, and high-level language.
When looking at performance benchmarks on TechEmpower.com, C# consistently scores highly. Granted, the code you see there is not the code a typical C# developer writes, but it doesn’t matter because only the hot path needs to be optimized like that. 99% of the code can stay readable and “a little wasteful” without impacting performance too much.
A more prudent choice would be to use Go, given that the official OpenTelemetry Collector is written in Go. It crossed our minds to fork the existing OpenTelemetry Collector and use that. There’s even an official ClickHouse exporter, which is the backend database we’re using. We couldn’t use it as-is, but we’d have a good starting point. In the end, the decision was made because C# and .NET were the technologies the team knew best. We knew how to optimize it, debug it, profile it, and maintain it—and that tilted the scale.
OTEL Collector Requirements
Let’s break down what it means to create an OTEL Collector in .NET.
The most basic way to describe a collector is as a service that receives telemetry from multiple sources, optionally processes it, and exports it to a backend.
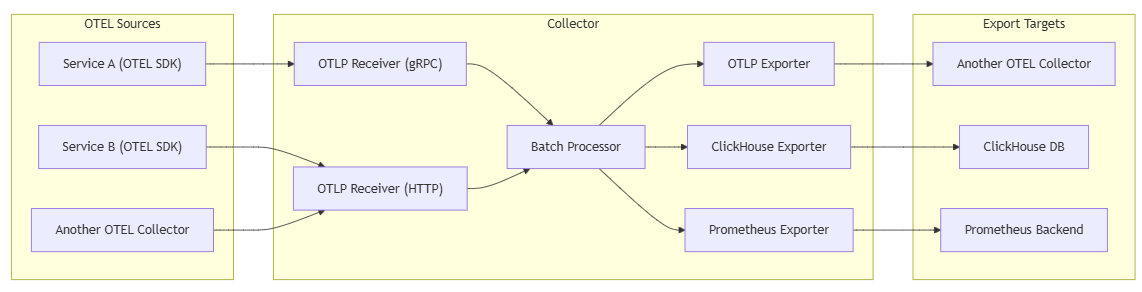
In our case, the protocol is the standard OpenTelemetry Protocol (OTLP). It can receive both HTTP and gRPC. In HTTP, the payload can be encoded as protobuf or as JSON, and it might be gzipped or not.
The collector should be able to accept 3 types of data: Logs, Traces, or Metrics. That makes 6 endpoints total: an HTTP endpoint and a gRPC endpoint for each type of data.
In the official OpenTelemetry Collector, you can configure different processors and exporters. But we didn’t have to allow configuration. We have a single use case and a single export target: our ClickHouse database.
Finally, security is a consideration. We had to allow ingestion using an API key that the customers would pass in request headers.
Implementation
Proto
The OpenTelemetry Protocol types can be built from the official proto files. It’s pretty easy to do—copy the entire opentelemetry folder to the root of your project and add the following lines into the .csproj:
<ItemGroup>
  <Protobuf Include="opentelemetry\proto\**\*.proto" GrpcServices="Server" />
</ItemGroup>
When the project builds, the relevant .cs files will appear—for example, OpenTelemetry.Proto.Logs.V1.LogRecord and OpenTelemetry.Proto.Logs.V1.ResourceLogs.
JSON
For deserializing OTLP JSON payloads, we chose not to use the same proto classes but rather to create new “regular” classes. I’m not sure it was the right decision, or how difficult it would have been to use the same classes for JSON. We thought the regular classes would be much simpler to work with. The counterargument, of course, is that we have to work with the proto classes anyway—except now we’re dealing with even more complexity.
In practice, there were some pros to this approach. For example, when generating test payloads, we’re using the regular classes, and they’re much easier to work with.
The actual process of generating classes for OpenTelemetry payloads is as simple as copy-pasting some JSON payload into a tool like https://json2csharp.com/. Or just ask any LLM to generate C# classes from the payload.
The classes look something like this:
public class Trace
{
    [JsonPropertyName("resourceSpans")]
    public List<ResourceSpan> ResourceSpans { get; set; }
}

public class ResourceSpan
{
    [JsonPropertyName("resource")]
    public Resource Resource { get; set; }

    [JsonPropertyName("scopeSpans")]
    public List<ScopeSpan> ScopeSpans { get; set; }
}

public class Resource
{
    [JsonPropertyName("attributes")]
    public List<Attribute> Attributes { get; set; }

    [JsonPropertyName("droppedAttributesCount")]
    public int DroppedAttributesCount { get; set; }
}

// ...
HTTP Backends
As mentioned before, we had to have 6 endpoints: gRPC for Logs, HTTP for Logs, gRPC for Traces, HTTP for Traces, gRPC for Metrics, and HTTP for Metrics.
As an example, here’s what the code for the HTTP Traces endpoint looks like:
app.MapPost("/api/otel/v1/traces", async (HttpRequest request, ILogger<Program> logger)=>
{
  var headers = request.Headers;
	string apiKey = ValidateApiKey(logger, clickHouseCredentials, headers);
	bool gzipped = request.Headers["Content-Encoding"].ToString().ToLower() == "gzip";
	if (request.Headers["Content-Type"] == "application/x-protobuf")
	{
	    using var bodyStream = request.Body;
	    using var memoryStream = new MemoryStream();
	    await bodyStream.CopyToAsync(memoryStream);
	    memoryStream.Position = 0;
	    TracesData traces = gzipped
	        ? TracesData.Parser.ParseFrom(DecompressGzippedPayload(memoryStream))
	        : TracesData.Parser.ParseFrom(memoryStream);
	    IngestTracesProtobuf.ExportResourceSpansToCache(traces.ResourceSpans);
	}
	else // JSON payload
	{
	    string requestBody = null;
	    if (gzipped)
	    {
	        using var gzipStream = new GZipStream(request.Body,
		        CompressionMode.Decompress);
	        using var reader = new StreamReader(gzipStream, Encoding.UTF8);
	        requestBody = await reader.ReadToEndAsync();
	    }
	    else
	    {
	        using var reader = new StreamReader(request.Body);
	        requestBody = await reader.ReadToEndAsync();
	    }

	    Trace traces = JsonSerializer.Deserialize<Trace>(requestBody,
		    new JsonSerializerOptions { PropertyNameCaseInsensitive = true })
		    ?? throw new InvalidDataException("Invalid traces");
	    IngestTracesJson.ExportResourceSpansToCache(traces.ResourceSpans);
	}
	});
It took some work to get this right, but in the end, the C# turned out not to be too difficult. About 30 lines of code, and we had a working OTLP endpoint for Traces.
Though I’ll admit that the separation of different classes for Protobuf and JSON makes the code smellier than it should be.
gRPC Backend
To implement gRPC, you have to register the appropriate middleware.
// Program.cs

var builder = WebApplication.CreateBuilder(args);
// ...
builder.Services.AddGrpc();
// ..
var app = builder.Build();
// ..
app.MapGrpcService<TraceGrpcService>();
Then, create a new class that inherits from OpenTelemetry.Proto.Collector.Trace.V1.TraceService.TraceServiceBase.
public class TraceGrpcService: TraceService.TraceServiceBase
{
    private readonly ILogger<TraceGrpcService> _logger;

    public TraceGrpcService(ILogger<TraceGrpcService> logger)
    {
        _logger = logger;
    }

    public override Task<ExportTraceServiceResponse> Export(ExportTraceServiceRequest request, ServerCallContext context)
    {
        IngestTracesProtobuf.ExportResourceSpansToCache(request.ResourceSpans);
        return Task.FromResult(new ExportTraceServiceResponse());
    }
}
This is it—we’re done. Everything is already implemented in the base class. The only addition was taking the received spans and sending them to the cache component.
Summing up
As it turns out, implementing an OpenTelemetry collector in C# is not that difficult. Once you’re able to compile .proto files into C# classes, there isn’t a huge amount of work to do.
It wasn't entirely smooth sailing, though. We had some weird bugs, but after ~6 months, I can say that all in all, the solution is working very well.
But frankly, there was little doubt as to whether it's possible to implement an OTLP collector in .NET. It's a straightforward problem, and C# has been supporting gRPC and Protobuf for a long time. The real test would be in performance. I’d love to do a benchmark and compare our C# solution to an equivalent one in Go. Maybe even more interesting would be to compare both to Rust.
Maybe in a future blog post. Cheers.