
By: Ron Miller | Published: March 11, 2025
Brilliant but Limited: Building a Logs Dashboard with Vercel V0 AI
I’ve been building applications and UI screens for many years. For dashboards and charts, that usually involves choosing a third-party control and then spending 90% of the time working on the customization and quirks of that control. But when I had to build a new page for Obics—a fairly standard log exploration screen—I decided to do things differently. This time, I’d take the crazy route of building everything from scratch using AI. I’m not saying this is the right approach, but building from scratch certainly has its advantages:
- The UI control is going to be more customizable than any third-party solution.
- New AI capabilities [supposedly] allow components to be made from scratch fairly quickly.
- To tweak something, I’d much rather spend time adding new functionality to my own component than digging through the documentation of some library or hacking a solution with CSS tricks and JavaScript.
- In the long term, companies whose core business is visualization and observability have their own design language. It’s very clear when looking at pages in DataDog, Grafana, or Dynatrace. To that end, if we plan for success, we’ll have to switch to a proprietary solution anyway.
- Performance. Consider that for a chart and a table, I would need several libraries that might be multiple megabytes in size, even when minified and zipped. I don't need all the bells and whistles—I just need a single use case of a table and a chart. Importing so much code seems wasteful.
Now that I’d decided to build the new Logs screen with AI, the next step was choosing the specific LLM tech. I was evaluating four models at the time:
- ChatGPT, which I was paying for and was fairly happy with. The o1 model is very good for code.
- Claude Sonnet 3.5, which I was using for free and trying to compare to o1 (without any real conclusion).
- DeepSeek, which was a nice surprise.
- Vercel V0, with which I had the least experience but it seemed very interesting.
I decided to go with V0. V0 provides an AI chatbot interface, just like all the others, but it also compiles and displays the React code it generates on the go. This is a brilliant development experience, and I figured it would save a ton of time. The second aspect of V0 is that it’s built on the popular shadcn components. I like shadcn because I'm both a fan of tailwind and because I much rather pasting some code instead of using a third party package.
The Spec
The plan was for the log exploration screen to look something like this (courtesy of DeepSeek):
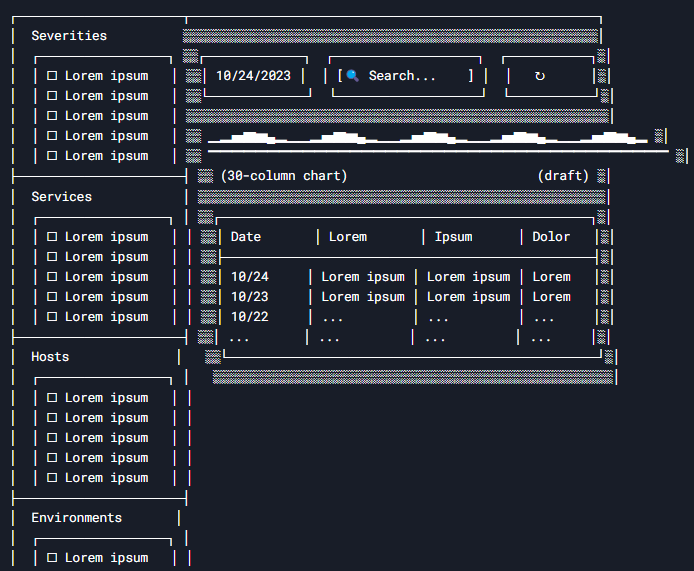
If you don't appreciate my ASCII art sketch and don’t mind spoilers, you can check out the final result here.
Breaking it down, there were the following components to create:
- Field filter
- Date picker
- Search box
- [Auto] Refresh button
- Log counts bar chart
- Logs table
Let’s see how Vercel V0 handled the job.
Creating a Field Filter
The first component I tried to create was the field filter. It’s a pretty straightforward UI, and I was confident that any half-decent LLM could handle it. It’s just a list of checkboxes with some features like “Select all,” “Select none,” and a filter box.
My prompt was:
I have an array of log severity items ['Trace','Debug','Info','Warn','Error','Fatal']. I want to allow the user to choose which severities to display with checkboxes for each severity level. The default is all checked. This will be displayed vertically in a sidebar.
Some 20 seconds later, V0 created this:
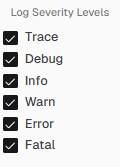
I continued with several prompts, asking for “All” and “None” buttons, a label with the number of selected items, and a filter box.
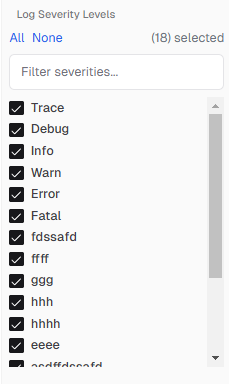
Up to this point, V0 was delivering. In less than five minutes, I had a working component with some functionality. Simple, but I was still impressed.
Just as I was getting excited, my next request tripped up the system. I asked to wrap this component in a collapsible group. My exact prompt:
Can you make this sidebar group collapsible with a chevron button? When minimized, it will show chevron-right. When expanded, it will show chevron-down.
V0 thought for a few seconds and delivered what looked like the right thing—but it didn’t actually work. Clicking on the chevron button didn’t do anything.

I tried three times to ask for a fix, but nothing helped. With every iteration, some little thing changed, but the expansion functionality remained broken.
Finally, I gave up and asked ChatGPT o1 to do it, which succeeded on the first try.
Here’s the full chat history with V0.
Creating a Date Picker
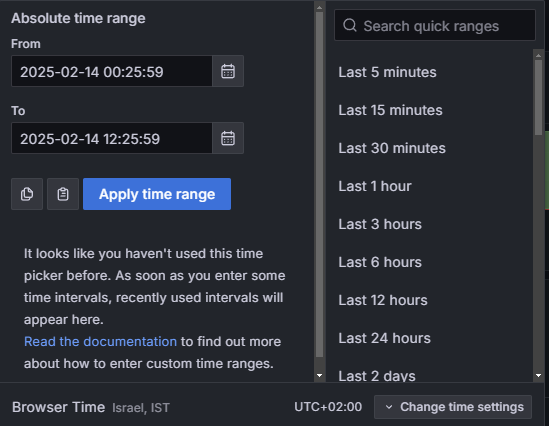
For the date picker, I wanted a control similar to the one Grafana has, where you can choose either specific “from” and “to” dates or a preset like “Last 30 minutes” or “Last 2 days.”
My initial prompt to V0 was:
date range picker that includes both dates and time and presets :last 5 m, last 15 min, 30min, 1h,3h,6h,12h,24h,2days,7days,30days, 90 days, last 1 year
This resulted in:
Not a bad start. Let’s improve it.
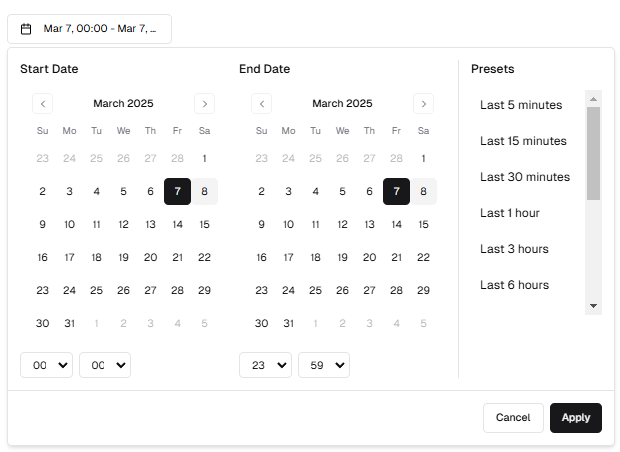
Add on the right of this an element to choose from one of the following presets: last 5 m, last 15, 30, 1h,3h,6h,12h,24h,2days,7days,30days, 90 days, last 1 year

Not quite what I wanted.
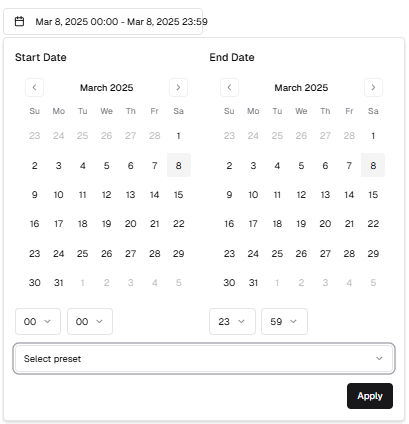
Show the date picker and the preset in the same popup side by side
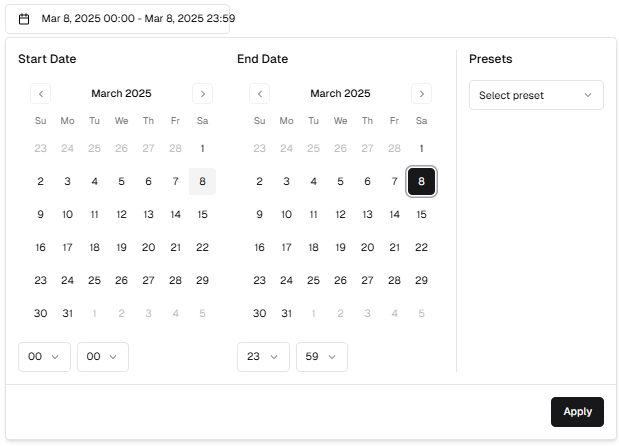
We’re almost there. After five more prompts, I finally got what I wanted. Although this won’t win any UI/UX awards, it was a good enough start. I’ll make it pretty later.
I copy-pasted the component into my project and started integrating all the features I wanted, including “zoom in/zoom out time range” and “go to previous/next period”. But when adding these capabilities, I ran into trouble. It seemed like everything I touched broke something else. After a lot of frustration, I came to the conclusion that the component’s model was unsustainable. If you look at the code, you’ll see that the Date and time are separate variables, even thought the date is of type Date, which can include time.
const [startDate, setStartDate] = useState(new Date()) // take just the year/month/date from this
const [startTime, setStartTime] = useState("00:00") // the time is taken from this
// ...
It leads to some very confusing development. To get the chosen time, I have to extract just the “Date” from the date variables and then add the “Time” from the time variables, so getting an actual date looks something like this:
const [hours, minutes] = timeString.split(":").map(Number);
const fullDate = new Date(date.getFullYear(), date.getMonth(), date.getDate(), hours, minutes);
Building functionality like “previous/next 1 hour” meant making those kinds of transitions back and forth several times, and things started to get gnarly. Fixing each bug caused two new bugs, and fixing those broke something else entirely. When I had to deal with time zones, all hell broke loose. Consider that a user might choose a date where it’s one day in their local time zone but a different day in UTC. But I won’t describe this horror show further.
After much frustration, I changed the underlying model to what it was supposed to be in the first place: a single Date object representing both date and time. The conversion to hours and minutes happens in the View, not in the model.
I’ve heard similar accounts from others, and I think this experience represents a general problem we’re having with AI: most of the time, it works like magic, and we start trusting it blindly. But sometimes, especially for harder tasks, it subtly fails. The problem is that the generated code looks very reasonable, and it might even work, but it can hide major bugs or bad architecture. When writing the code yourself, you naturally ask yourself about edge cases and handle them. But when you trust AI-generated code, these issues can be overlooked, only to come back later and bite you in the butt.
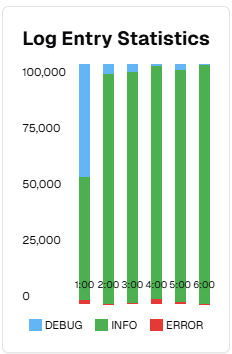
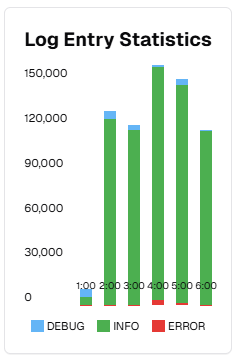
Making the bar chart
I thought the biggest challenge for V0 would be this component: a column chart that represents log counts in the chosen period. Without using any third-party components. By default, Vercel V0 tries to use the recharts package, but let’s see if we can make it do the work from scratch with this prompt:
... I don't want any additional packages like recharts but I am using shadcn. Can you make this on your own without using recharts?
This resulted in:
Well, it’s certainly something. Let’s try and improve it a bit.
The bars all seem to be the same height but they should be relative to their values at each time point
A few prompts later, V0 fixed some of the problems and even added some features.
Let's add some features:
1. Add a light-gray background to the chart. Each "cell" should be about 50 pixel wide and 12 pixel tall.
2. The Y axis labels should be aligned to the right, so that single-digit labels like "0" will be adjacent the chart
3. Clicking on legend item will toggle them "on/off" as if they didn't appear in the data when "off"
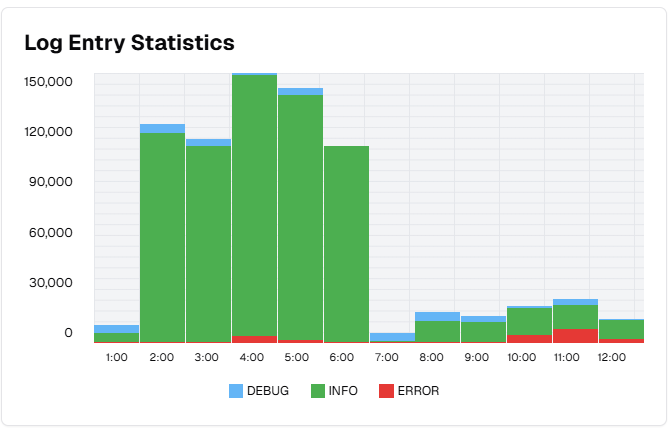
The results were slowly turning into something I actually considered using, though there were a few bugs that V0 just couldn’t seem to get right. For example, when hovering over the bars, a tooltip was supposed to appear and show values. It did appear for a moment but then immediately disappeared. Fixing the bugs by asking the AI them didn’t work. After a few prompts, I changed tactics—I looked at the code, saw a potential cause for the problem, and told V0 exactly what to fix.
The tooltip still disappears quickly after it appears. It seems that "handleMouseLeave" is triggered even when the mouse stays within the bounds of the bar. Maybe move the logic of hiding the tooltip to "handleMouseMove"
This prompt finally did the trick, which made me think that AI is still far off from replacing us mortals.
I tried to tweak the component a bit more, like expanding the margins between the bars, but at this point, each prompt was making things worse rather than better. I even tried a few “forks” of the conversation—another neat feature of Vercel V0—but to no avail. Still, the component was already good enough for me to take it from there.
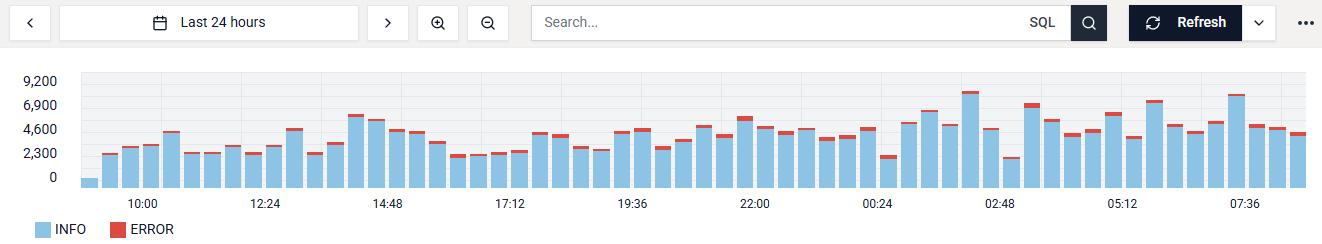
V0 did the initial scaffolding in 15 minutes, which would have otherwise taken me a day or two. Not that I would ever consider building a chart on my own without the help of AI.
After some manual styling and customization, I got a half-decent bar chart without using any third-party library.
See the full conversation here.
Building the table
Looking at some third-party tables like AgGrid (1MB minified, 250KB minified & gzipped) and MUI X Data Grid (350KB minified, 100KB gzipped), I figured creating a table from scratch should be a big performance saver. It's not just the download size too, consider how much code is packed into 1MB minified. That’s a lot of HTML to render and a lot of JavaScript to run. Sure, modern computers can handle it, but it seems wasteful.
My first prompt to V0 was:
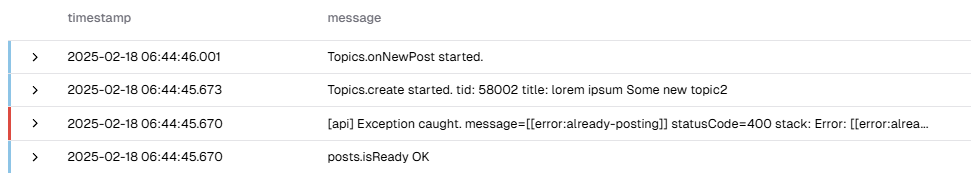
create a table where each row can be expanded vertically by clicking on it. When expanded, the row expands vertically and it contains the original minimized content on top and another element below. The code might look something like this:

<TableBody>
  {invoices.map((invoice) => (
    <TableRow key={invoice.invoice}>
      <TableCell className="font-medium">{invoice.invoice}</TableCell>
      <TableCell>{invoice.paymentStatus}</TableCell>
      <TableCell>{invoice.paymentMethod}</TableCell>
      <TableCell className="text-right">{invoice.totalAmount}</TableCell>
      <ExpandedInvoice item={invoice} />
    </TableRow>
  ))}
</TableBody>
where ExpandedInvoice will be displayed only when the row is in expanded mode
This resulted in the following:
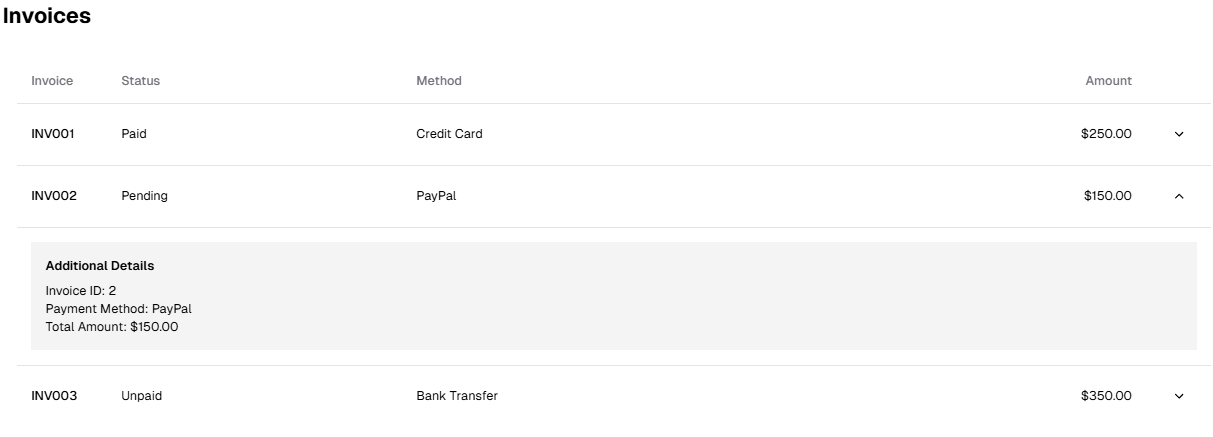
I added some styling and color indicators:
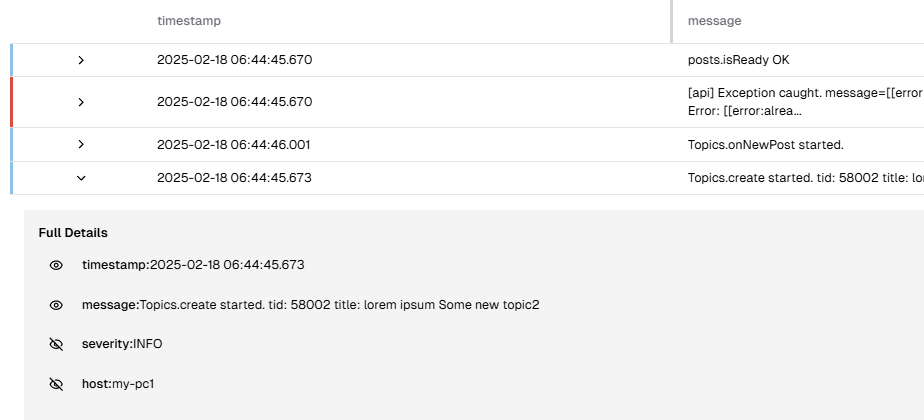
Adding sorting capabilities worked well too, but V0 stumbled when I asked to add “column resize” functionality. It sort of worked, but the column wasn’t resizing according to mouse movement, and unrelated columns seemed to be affected. More prompts didn't help and eventually I had to fix this one myself.
I also asked to add little “eye” icons near each field to allow showing and hiding columns. This worked quite well.
At this point, the AI seemed to have exhausted itself. It failed to implement any new features or do bug fixes.
This was a recurring theme now—V0 works well up to some point and then things seem to get too difficult for it. I guess V0 can’t handle large contexts just yet.
But I consider this component as a win. V0 did a lot of the hard work—most of what a third-party library would provide—and I could take it from there.
Here is the final result (see on site):
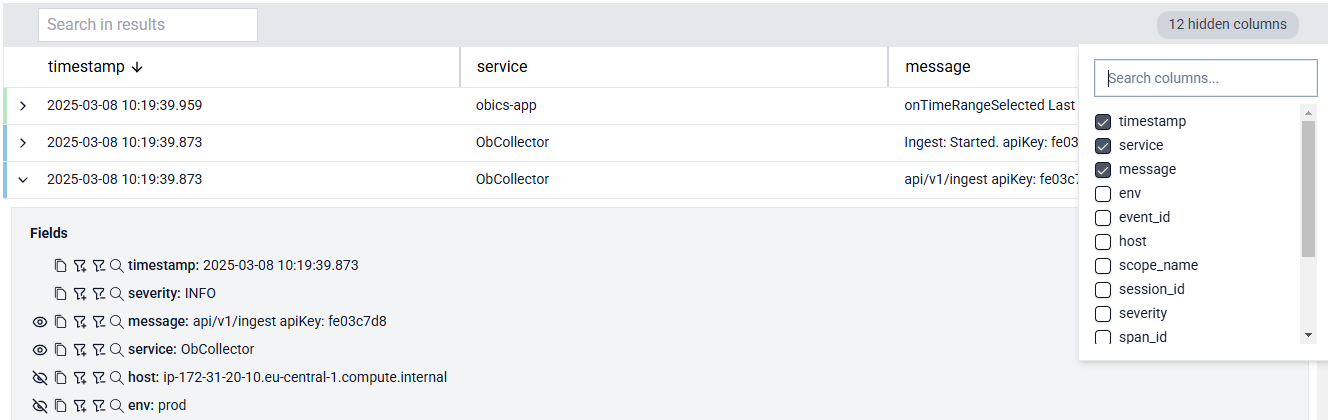
Having learned my lesson from the date picker, I reviewed the code carefully this time. There were some things I didn’t like, but overall, it was decent.
Conclusion
I think Vercel nailed the form factor of creating React components with LLMs. Everything about the experience is well thought out, starting from the in-app preview of the component to the ability to view and edit the code yourself, and the conversation fork feature.
The specific choice of using shadcn components and Tailwind is a factor to consider. Personally, I'm a huge fan of both. I'd much rather have components in my own source folder that I can tweak and customize. But I can see how others might shy away from it.
On the flip side, the AI capabilities are not impressive compared to the newer models by OpenAI, Anthropic, and Google. There were several instances where V0 failed to do what I asked, but ChatGPT got the job done on the first attempt.
In conclusion, V0 offers a great experience for getting started with building UI from scratch. The best I experienced personally. But it’s not on par with newer LLMs when you ask for more advanced capabilities, especially when the components get bigger and more complex.
As for me, I'll keep using V0 to scaffold new screens and components—but with a healthy dose of skepticism about the code it writes.