Observability with Big Data Analytics
Obics is an observability solution that enables advanced analytics in real time. We know that with scale and big data, traditional solutions like "Live tail," text search, field filtering, and basic aggregations aren't enough. You need the ability to investigate big telemetry data with an analytics platform that allows correlating events, using subqueries, transforming data, and performing fast aggregations on as much as petabytes of data. That's what Obics can give you.
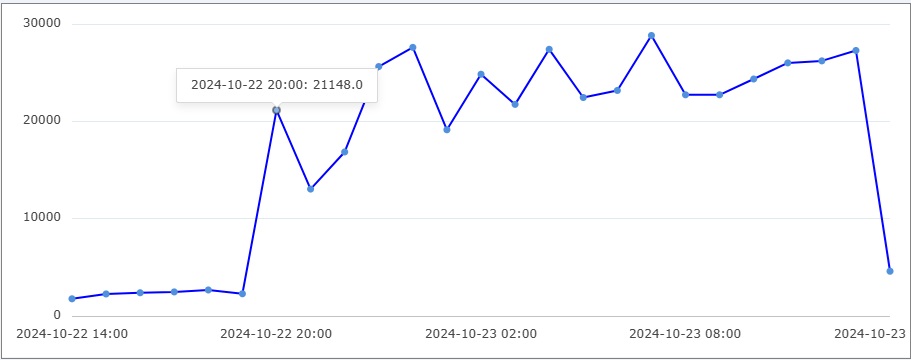
Here's an example: let's say you come to work in the morning and want to check the system's health. You might start with a query to see if there were any errors in the last 24 hours.
SELECT count(*), toStartOfHour(Time) as hour
FROM Logs
WHERE Level = 'Error' AND Time > now() - INTERVAL 1 DAY
GROUP BY hour
ORDER BY hour
VISUALIZE TIMECHART
After 57 milliseconds...

Oh boy, there was some kind of spike at 8 PM. First things first, let's find out which service is causing these errors.
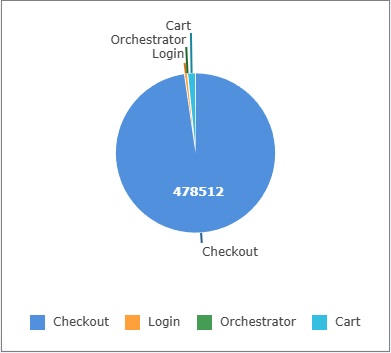
Since we have a microservice architecture, each log contains a Service field, so it should be easy to figure out.
SELECT count(*), Service
FROM Logs
WHERE Level = 'Error' AND Time > now() - INTERVAL 1 DAY
GROUP BY Service
VISUALIZE PIECHART
After 44 milliseconds...

Seems like it's the Checkout service again. Figures—it just went through a big update. So the picture is getting a bit clearer, but we still don't know what the error was. Since all error logs in the Checkout service have a fixed JSON structure, we can group the errors by the reason field. Let's check the top 5 errors in the Checkout service from the last 24 hours. Error logs in this app are formatted as JSON and have the reason field, so it should be pretty easy to figure out with a query.
SELECT count(*) as times,
  JSONExtractString(Message, 'reason') as reason
FROM Logs
WHERE Level = 'Error' AND Service = 'Checkout'
  AND Time > now() - INTERVAL 1 DAY
GROUP BY reason
ORDER BY times DESC
LIMIT 5
After 126 milliseconds...
| times | reason |
|---|---|
| 267084 | Item is out of stock |
| 267078 | No items to left checkout |
| 969 | Invalid access token |
| 482 | Request timed out |
| 138 | Session timed out |
'Item is out of stock' and 'No items left to checkout' seem to be causing the issue. Since they have the same count, it's probably the same core issue behind both errors. Could it be that some popular item is out of stock? That's weird—if an item is out of stock, the user shouldn't be able to add it to the cart. But we can start by looking at the cart items at the time of the error. Since we have a log that prints the cart items, we can join the error log with the cart log on the TraceId field.
The log that prints cart items appears just before checkout. For example: "Toy car,Basketball,Robot".
The log's code is written like this:
obics.info('cart6', cartItems.join(','));
Note that the string cart6 is the Log ID, which will appear in the LogId field in the logs. While not necessary, it's a good practice to uniquely name your logs, as it allows for easier analytics.
Now you can use arrayJoin to split the array into rows and then join the logs. The query would look like this:
with products as
(
    SELECT arrayJoin(splitByString(',',Message)) as product,
      CorrelationId
    from Logs
    WHERE LogId = 'cart6'
)
SELECT count(*) as times, R.product as product
FROM Logs as L
INNER JOIN products as R
ON L.CorrelationId = R.CorrelationId
GROUP BY product
ORDER BY times DESC
LIMIT 3
I realize this is a bit of a complex example, but it shows the power of OLAP queries on logs. In this case, I'll get the top 3 products that were in the cart when the error occurred. The result would look like this:
After 311 milliseconds...
| times | product |
|---|---|
| 267084 | Toy car |
| 74245 | Deodorant |
| 65810 | Slippers |
It seems that the Toy car is the most popular item in the cart. It's possible there's a bug in the system that allows users to add the Toy car to the cart even when it's out of stock. Maybe this product's inventory was depleted, but the new amount wasn't updated for some services. I'll leave this investigation here, assuming our hypothetical engineer figured out the problem.
Want to try it yourself? Try out the sandbox
