
Obics Documentation
Obics finds the logs and metrics that are quietly inflating your observability bill, traces each one back to the exact line of source code that emits it, and opens a pull request that fixes it.
You connect two things: your observability vendor (Datadog, Grafana, CloudWatch, Coralogix) and your source code host (GitHub, GitLab, Azure DevOps). From then on Obics scans your telemetry, ranks every log group and metric by how much it costs, explains what to do about it, and, when you approve, writes the code change for you.
What you can do with Obics
Section titled “What you can do with Obics”| Goal | Where you do it |
|---|---|
| Connect your telemetry and code | Integrations |
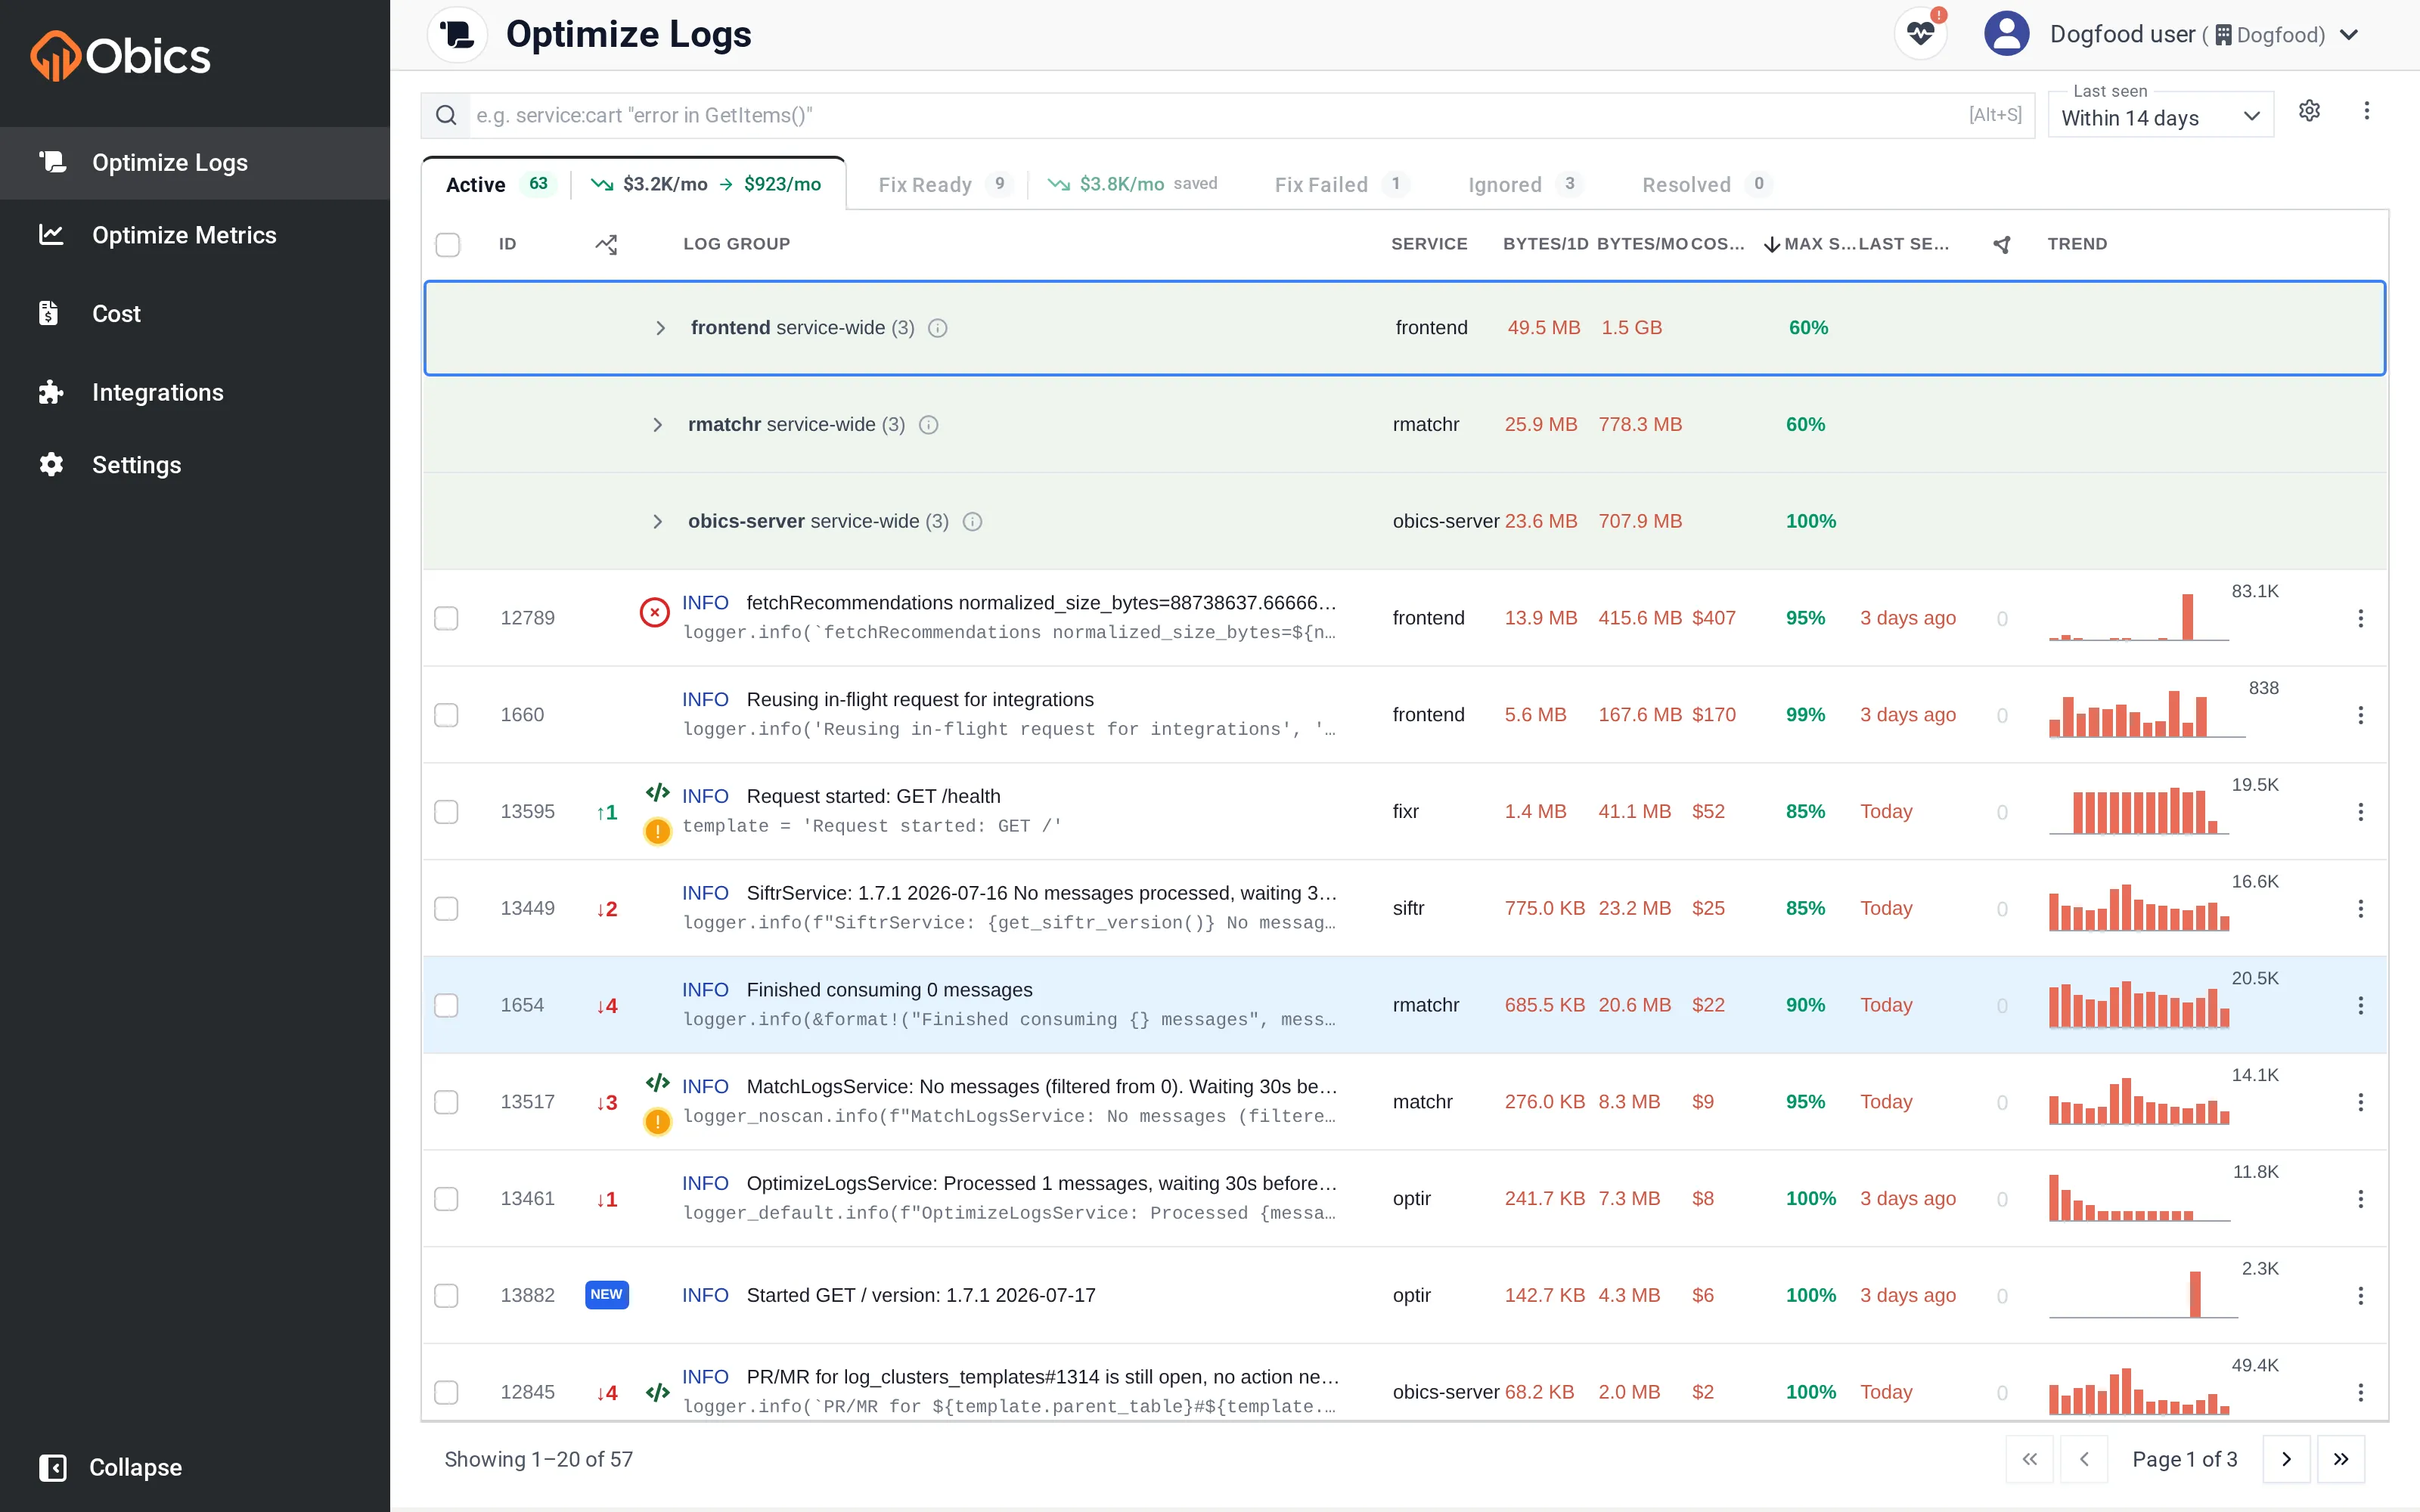
| See which logs waste the most money | Optimizing logs |
| See which metrics blow up cardinality | Optimizing metrics |
| Turn a recommendation into a pull request | Applying fixes |
| Track spend and savings over time | Cost Explorer |
| Estimate savings before you act | Savings Forecast |
New here?
Section titled “New here?”- Create your account: sign up for the free tier or accept a team invitation.
- Connect your integrations: one observability provider and one source-code provider.
- Run your first scan, or wait for the automatic nightly scan.
- Review recommendations and create a fix.