
Savings Forecast
The Savings Forecast answers the “what if” question: how much would I save if I acted on my recommendations? It projects savings from a scan, so you can build a business case before opening any pull requests.
Header and controls
Section titled “Header and controls”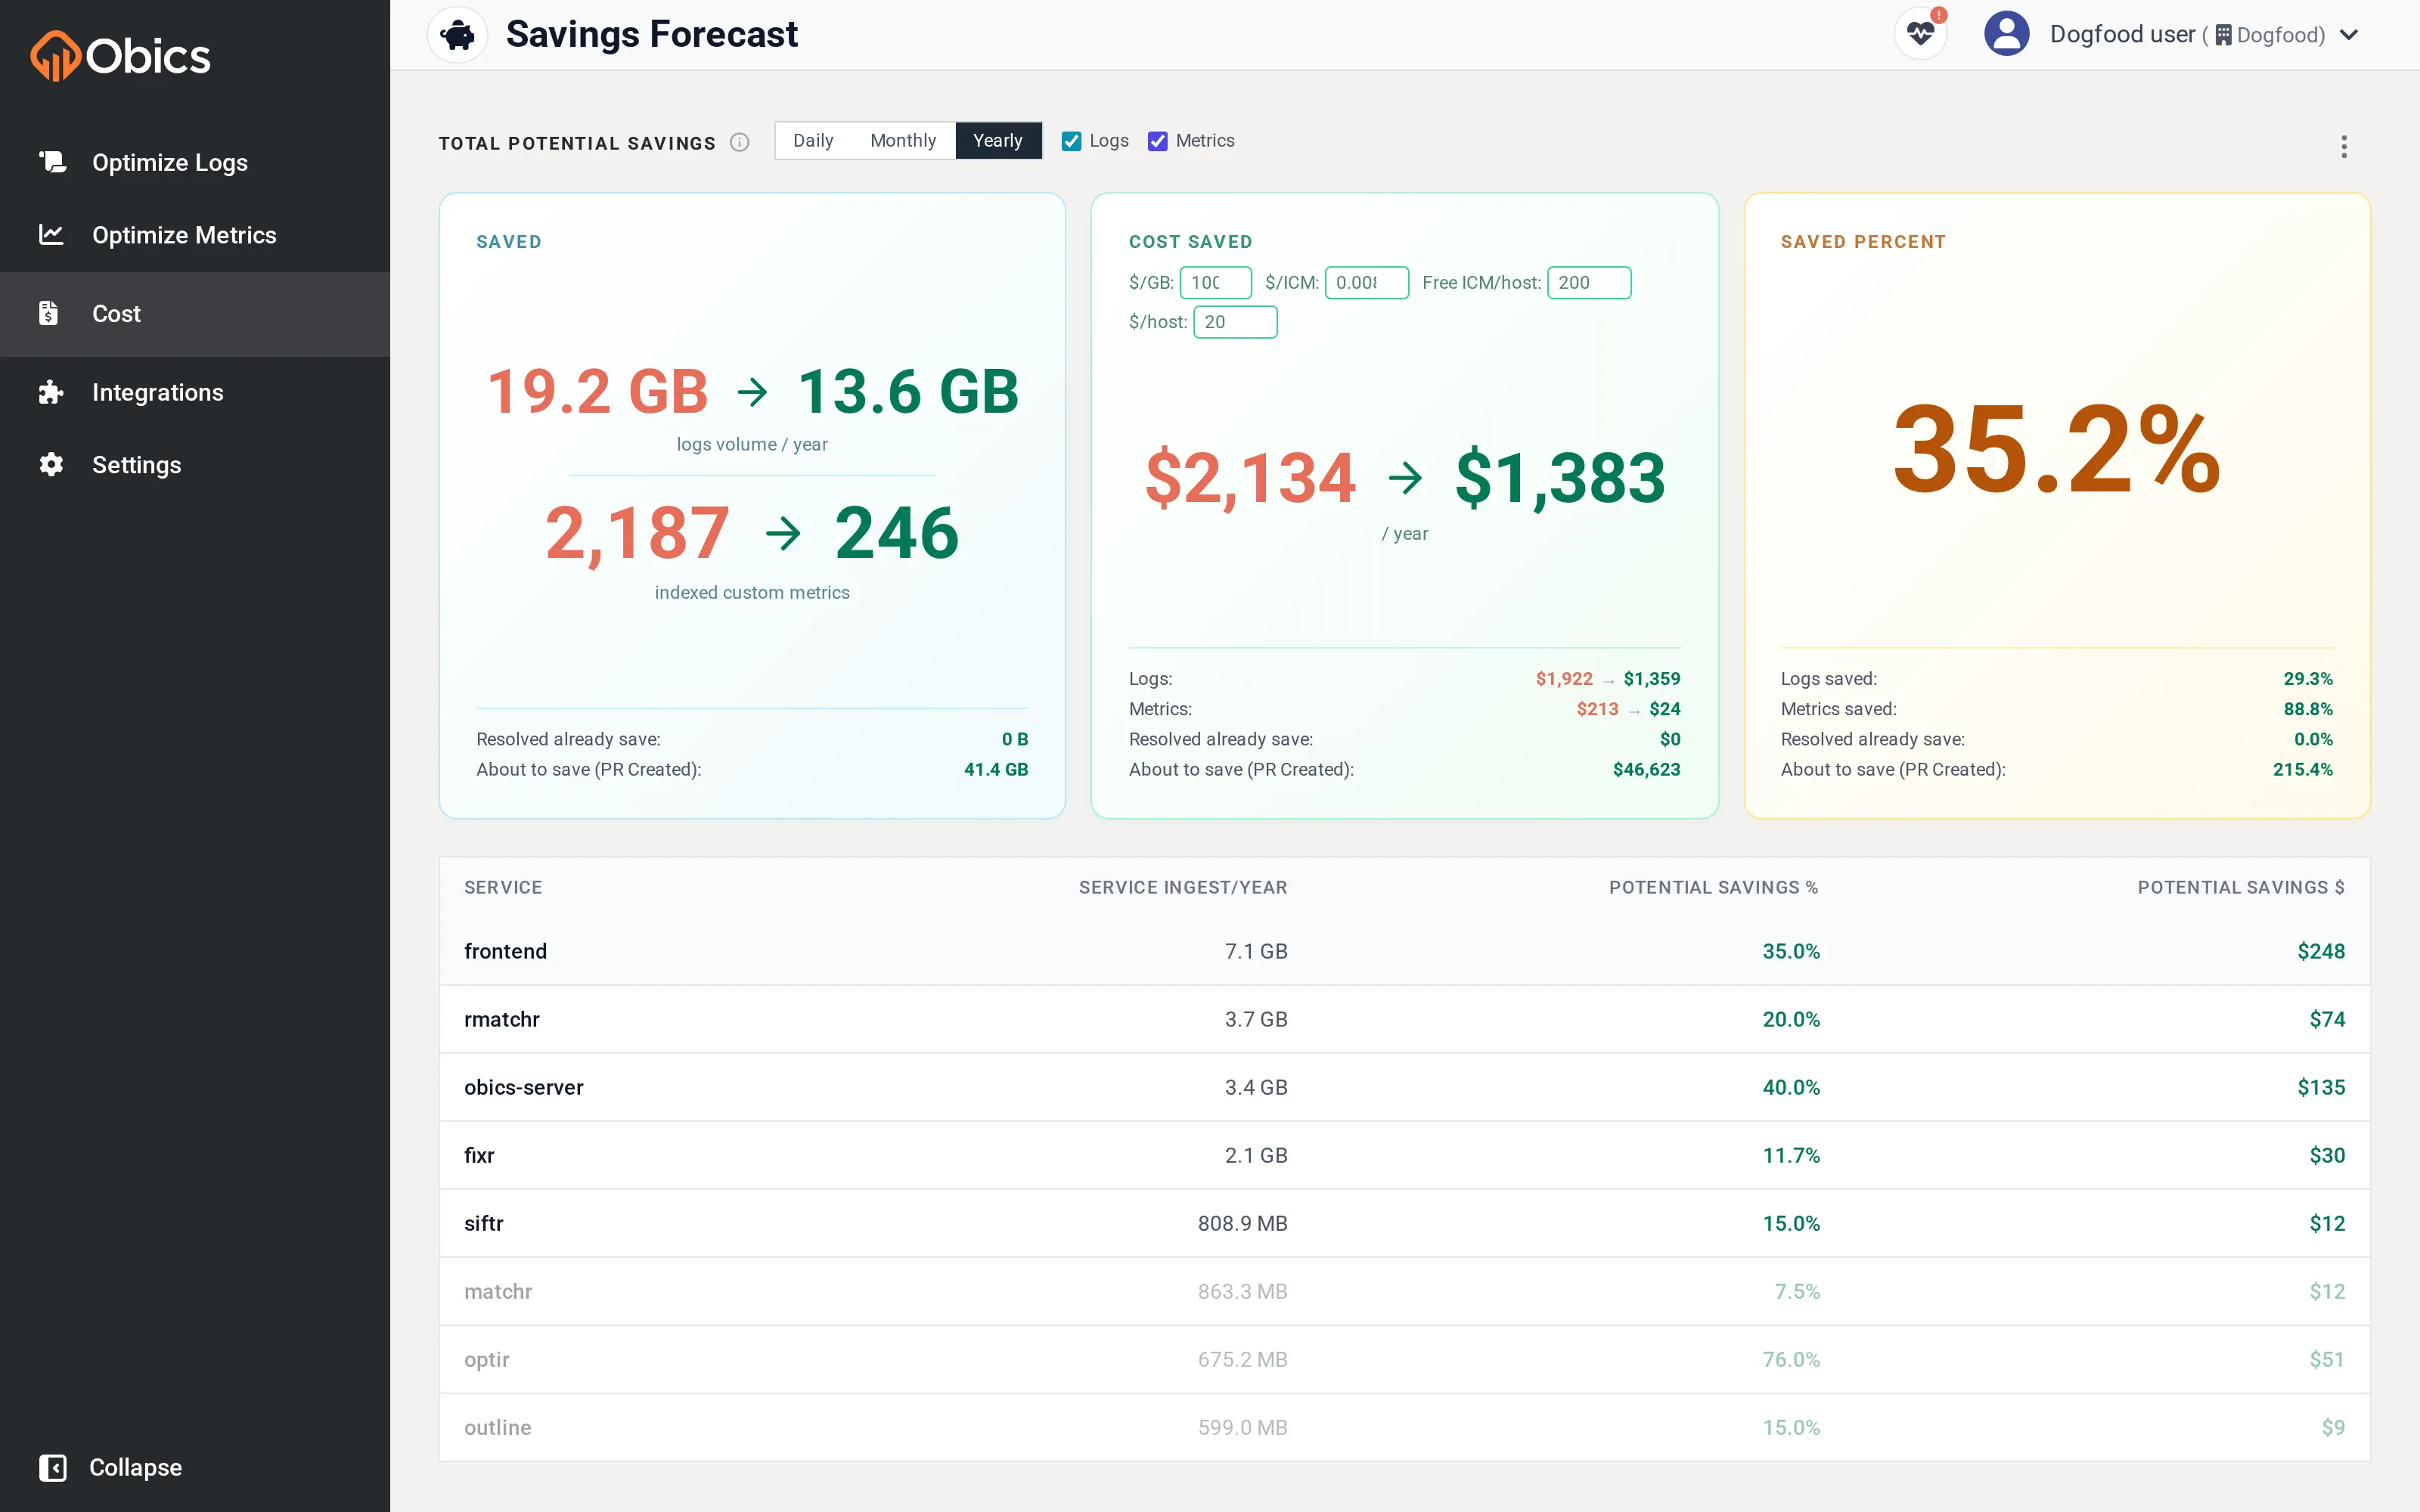
At the top, Total Potential Savings summarizes the projection. Controls beside it let you shape it:
| Control | Options |
|---|---|
| Period | Daily / Monthly / Yearly. |
| Logs / Metrics | Include either or both (when metrics data exists). |
| Include host cost | Factor in per-host pricing, with an Avg hosts/day readout. |
| Scan selector | Which scan to base the forecast on. |
| Savings source (⋮ menu) | Both (bigger value), Segment-wide only, or Log group only. |
Summary cards
Section titled “Summary cards”| Card | Shows |
|---|---|
| Saved | Before → after for logs volume and indexed custom metrics, plus lines for already resolved and about to save (PR Created). |
| Cost Saved | The dollar saving, with editable pricing inputs (cost per GB, $ per indexed custom metric, free ICM per host, price per host) so the estimate matches your contract. |
| Potential Savings % | The overall percentage. |
Per-service table
Section titled “Per-service table”Below the cards, a table breaks the forecast down by service: Service, Service Ingest (per your chosen period), Potential Savings %, and Potential Savings $, so you can see which services offer the biggest wins.