
Optimizing logs
The Optimize Logs page is the heart of Obics for log cost. It shows your log noise as a ranked table of log groups (each row is a cluster of near-identical log lines collapsed into one pattern), ordered by how much they cost per month.
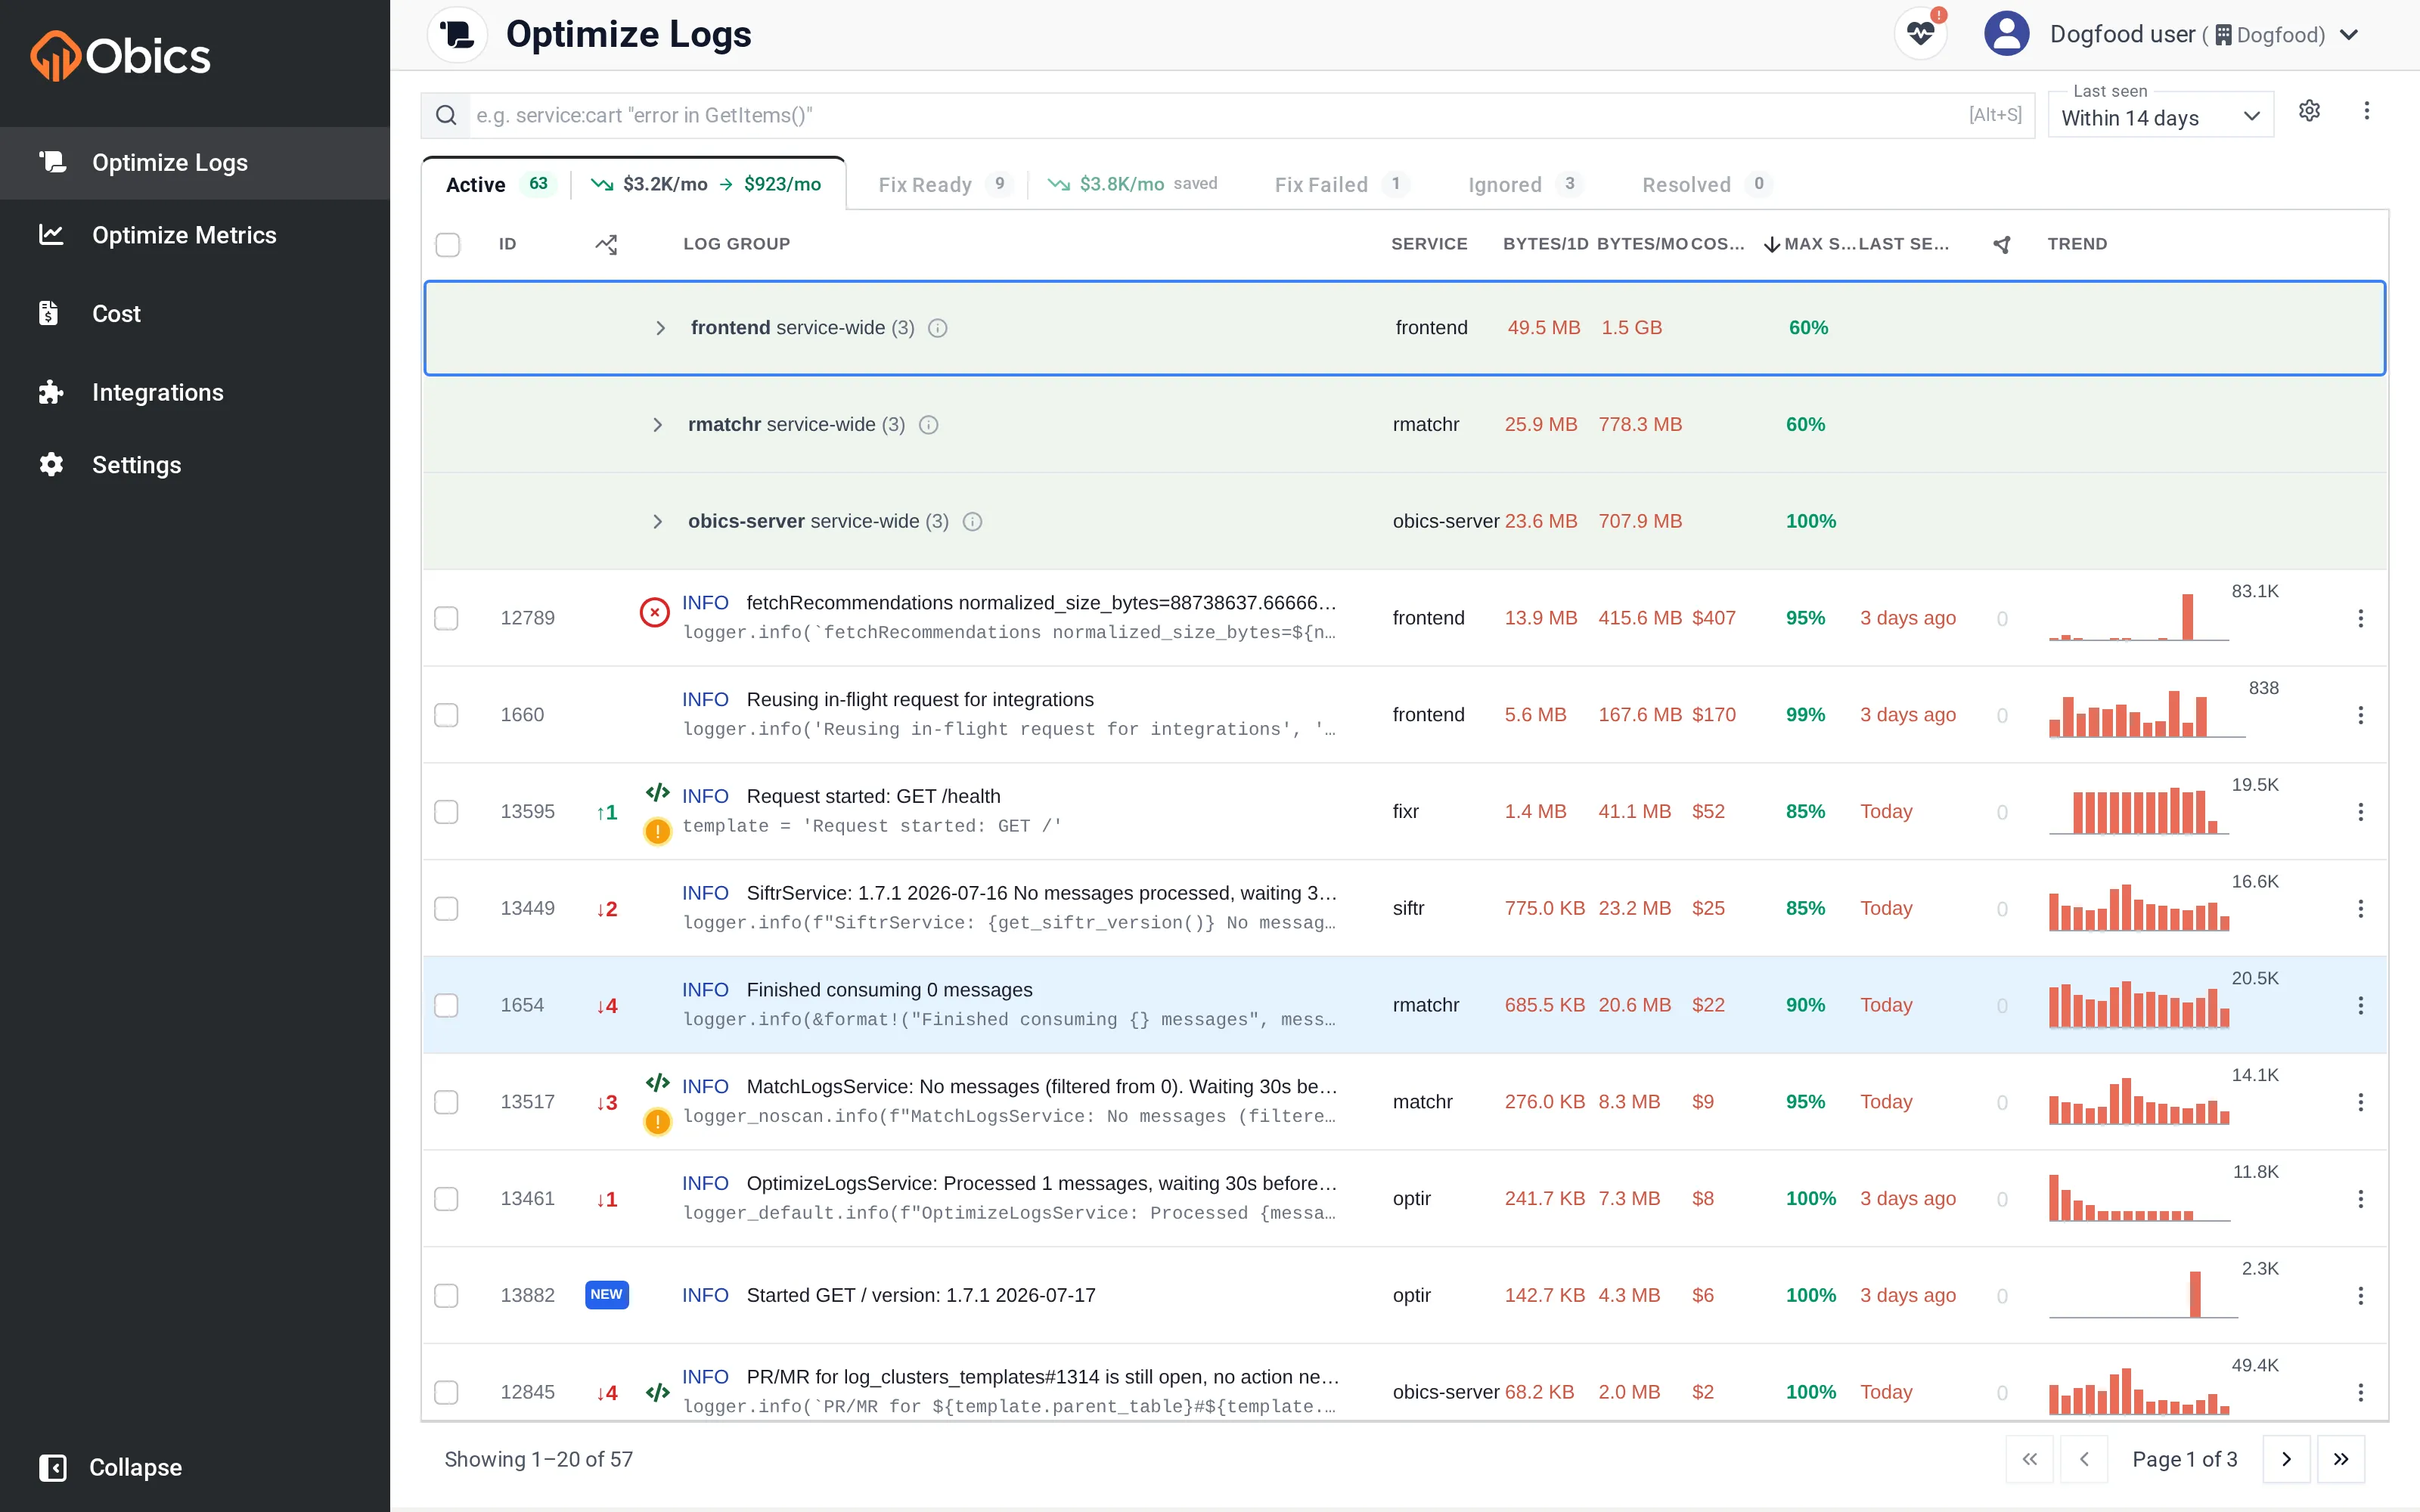
The tabs
Section titled “The tabs”A row of tabs sits above the table. Each shows a count and, on some, a savings badge.
| Tab | What it contains |
|---|---|
| Active | The current scan’s live findings: log groups still generating noise, with recommendations you can act on. The badge shows potential savings from this scan. |
| Fix Ready | Log groups where a fix has been prepared and a pull request is waiting to merge. Badge = estimated savings once merged. |
| Fix Failed | Fixes that were attempted but failed (only appears when there are any). |
| Ignored | Log groups you dismissed so they stop cluttering the Active view. |
| Resolved | Fixes that landed and were marked resolved. Badge = realized savings. |
(Ctrl+] / Ctrl+[ cycle the tabs.)
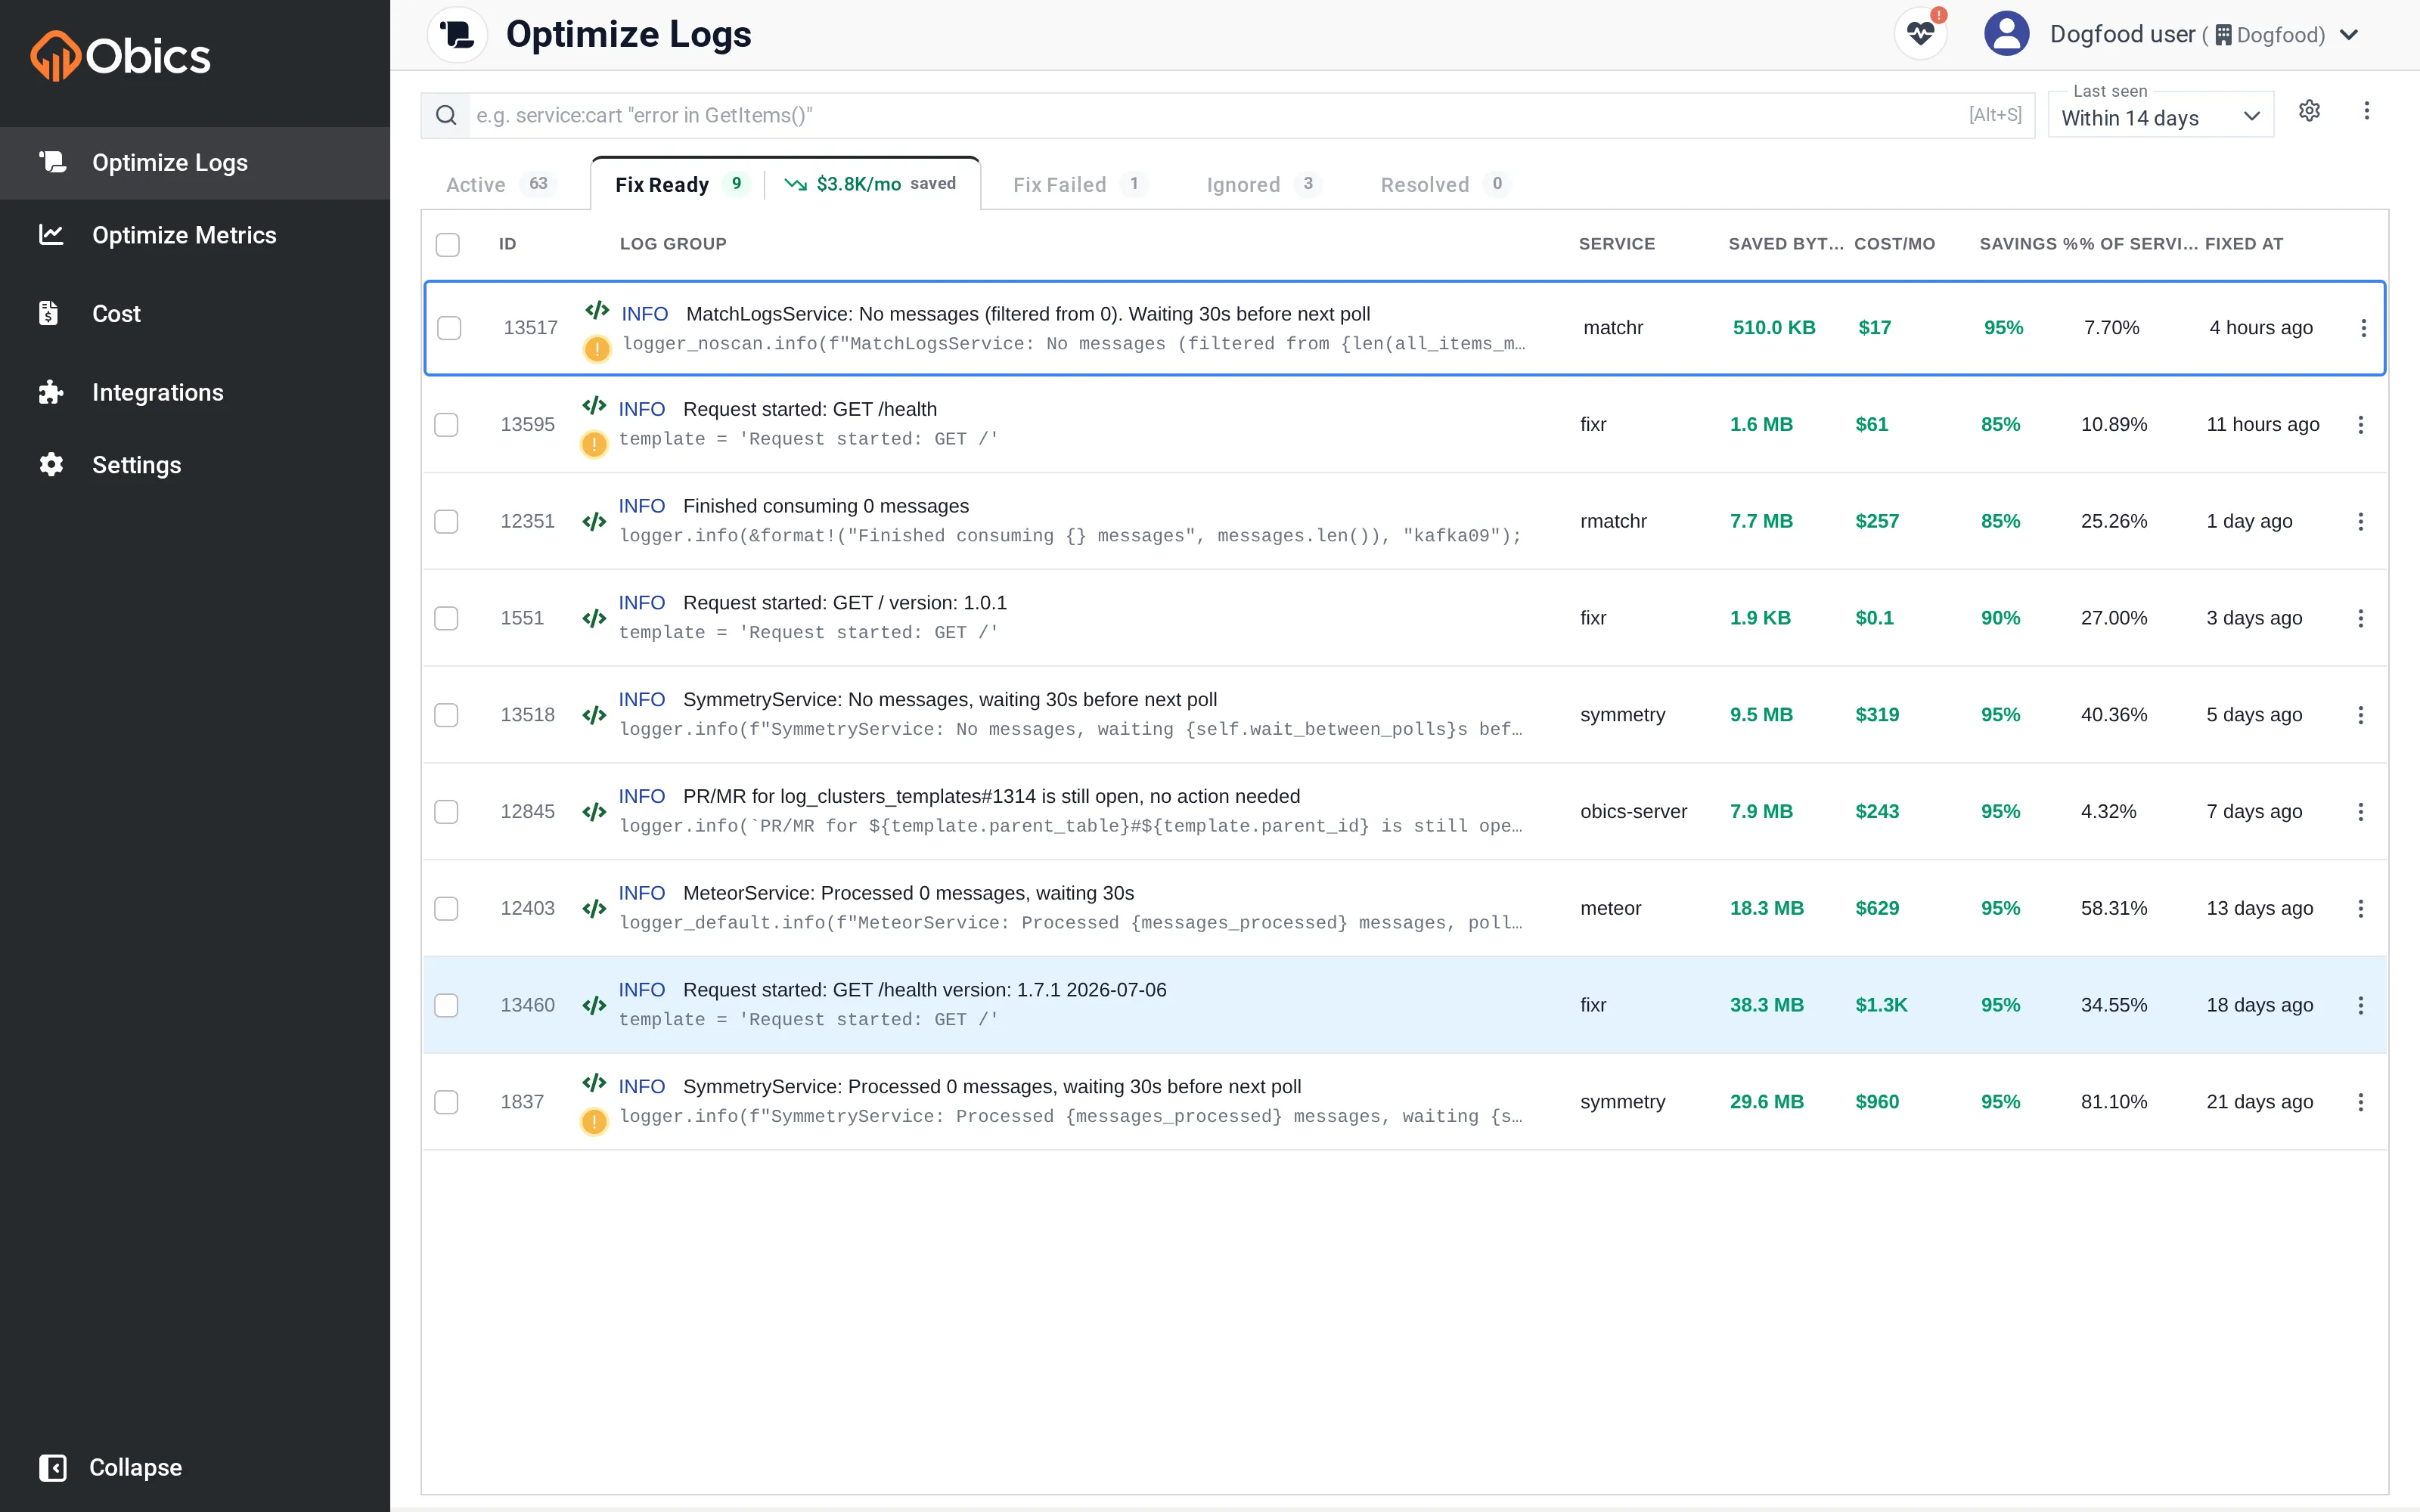
The columns
Section titled “The columns”The Active tab shows, per log group:
| Column | Meaning |
|---|---|
| ID | The log group’s display ID. |
| Δ | Rank change versus the previous scan. |
| Log group | The log message (sample or normalized template) with the matched source line beneath it in grey. |
| Service | Which service emits it. |
| Bytes/1d | Ingest in the 24h before the last scan. |
| Bytes/mo | Projected monthly ingest. |
| Events/mo | Projected monthly event count (millions). |
| Cost/mo | Forecast monthly cost (ingest + indexing + events). |
| Max Savings % | The best available saving from its suggestions. |
| First seen / Last seen | When Obics first and last saw this group. |
| Retention | How long this service’s logs are kept. |
| Trend | A sparkline of recent volume. |
The gear (Settings) button toggles columns and switches the Log group cell
between the raw sample and the normalized template. Service-wide items are
tinted green and can collapse under a “service service-wide (N)” header.
The recommendation types
Section titled “The recommendation types”Each log group carries one or more suggestions. The common types:
| Type | What it proposes |
|---|---|
| Reduce Verbosity | Lower the log’s level (e.g. to debug) or gate it behind a flag. |
| Remove Duplicate | Delete a log that duplicates another. |
| Reduce Redundancy | Trim redundant fields or repeated content. |
| Aggregate Logs | Replace many per-event logs with a periodic summary or counter. |
| Sample (HotPathLogs) | Keep the log but emit only a fraction (e.g. 1%) on a hot path. |
| Custom Instruction | A remediation you wrote yourself. |
Every suggestion also shows a savings % and a Visibility Loss Risk badge (Low, Medium, or High Risk), so you can weigh the saving against how much diagnostic visibility you’d give up. An amber Side Effects badge means applying it also needs a change on the vendor side (like an exclusion filter).
The detail popup
Section titled “The detail popup”Click any row to open its detail popup.
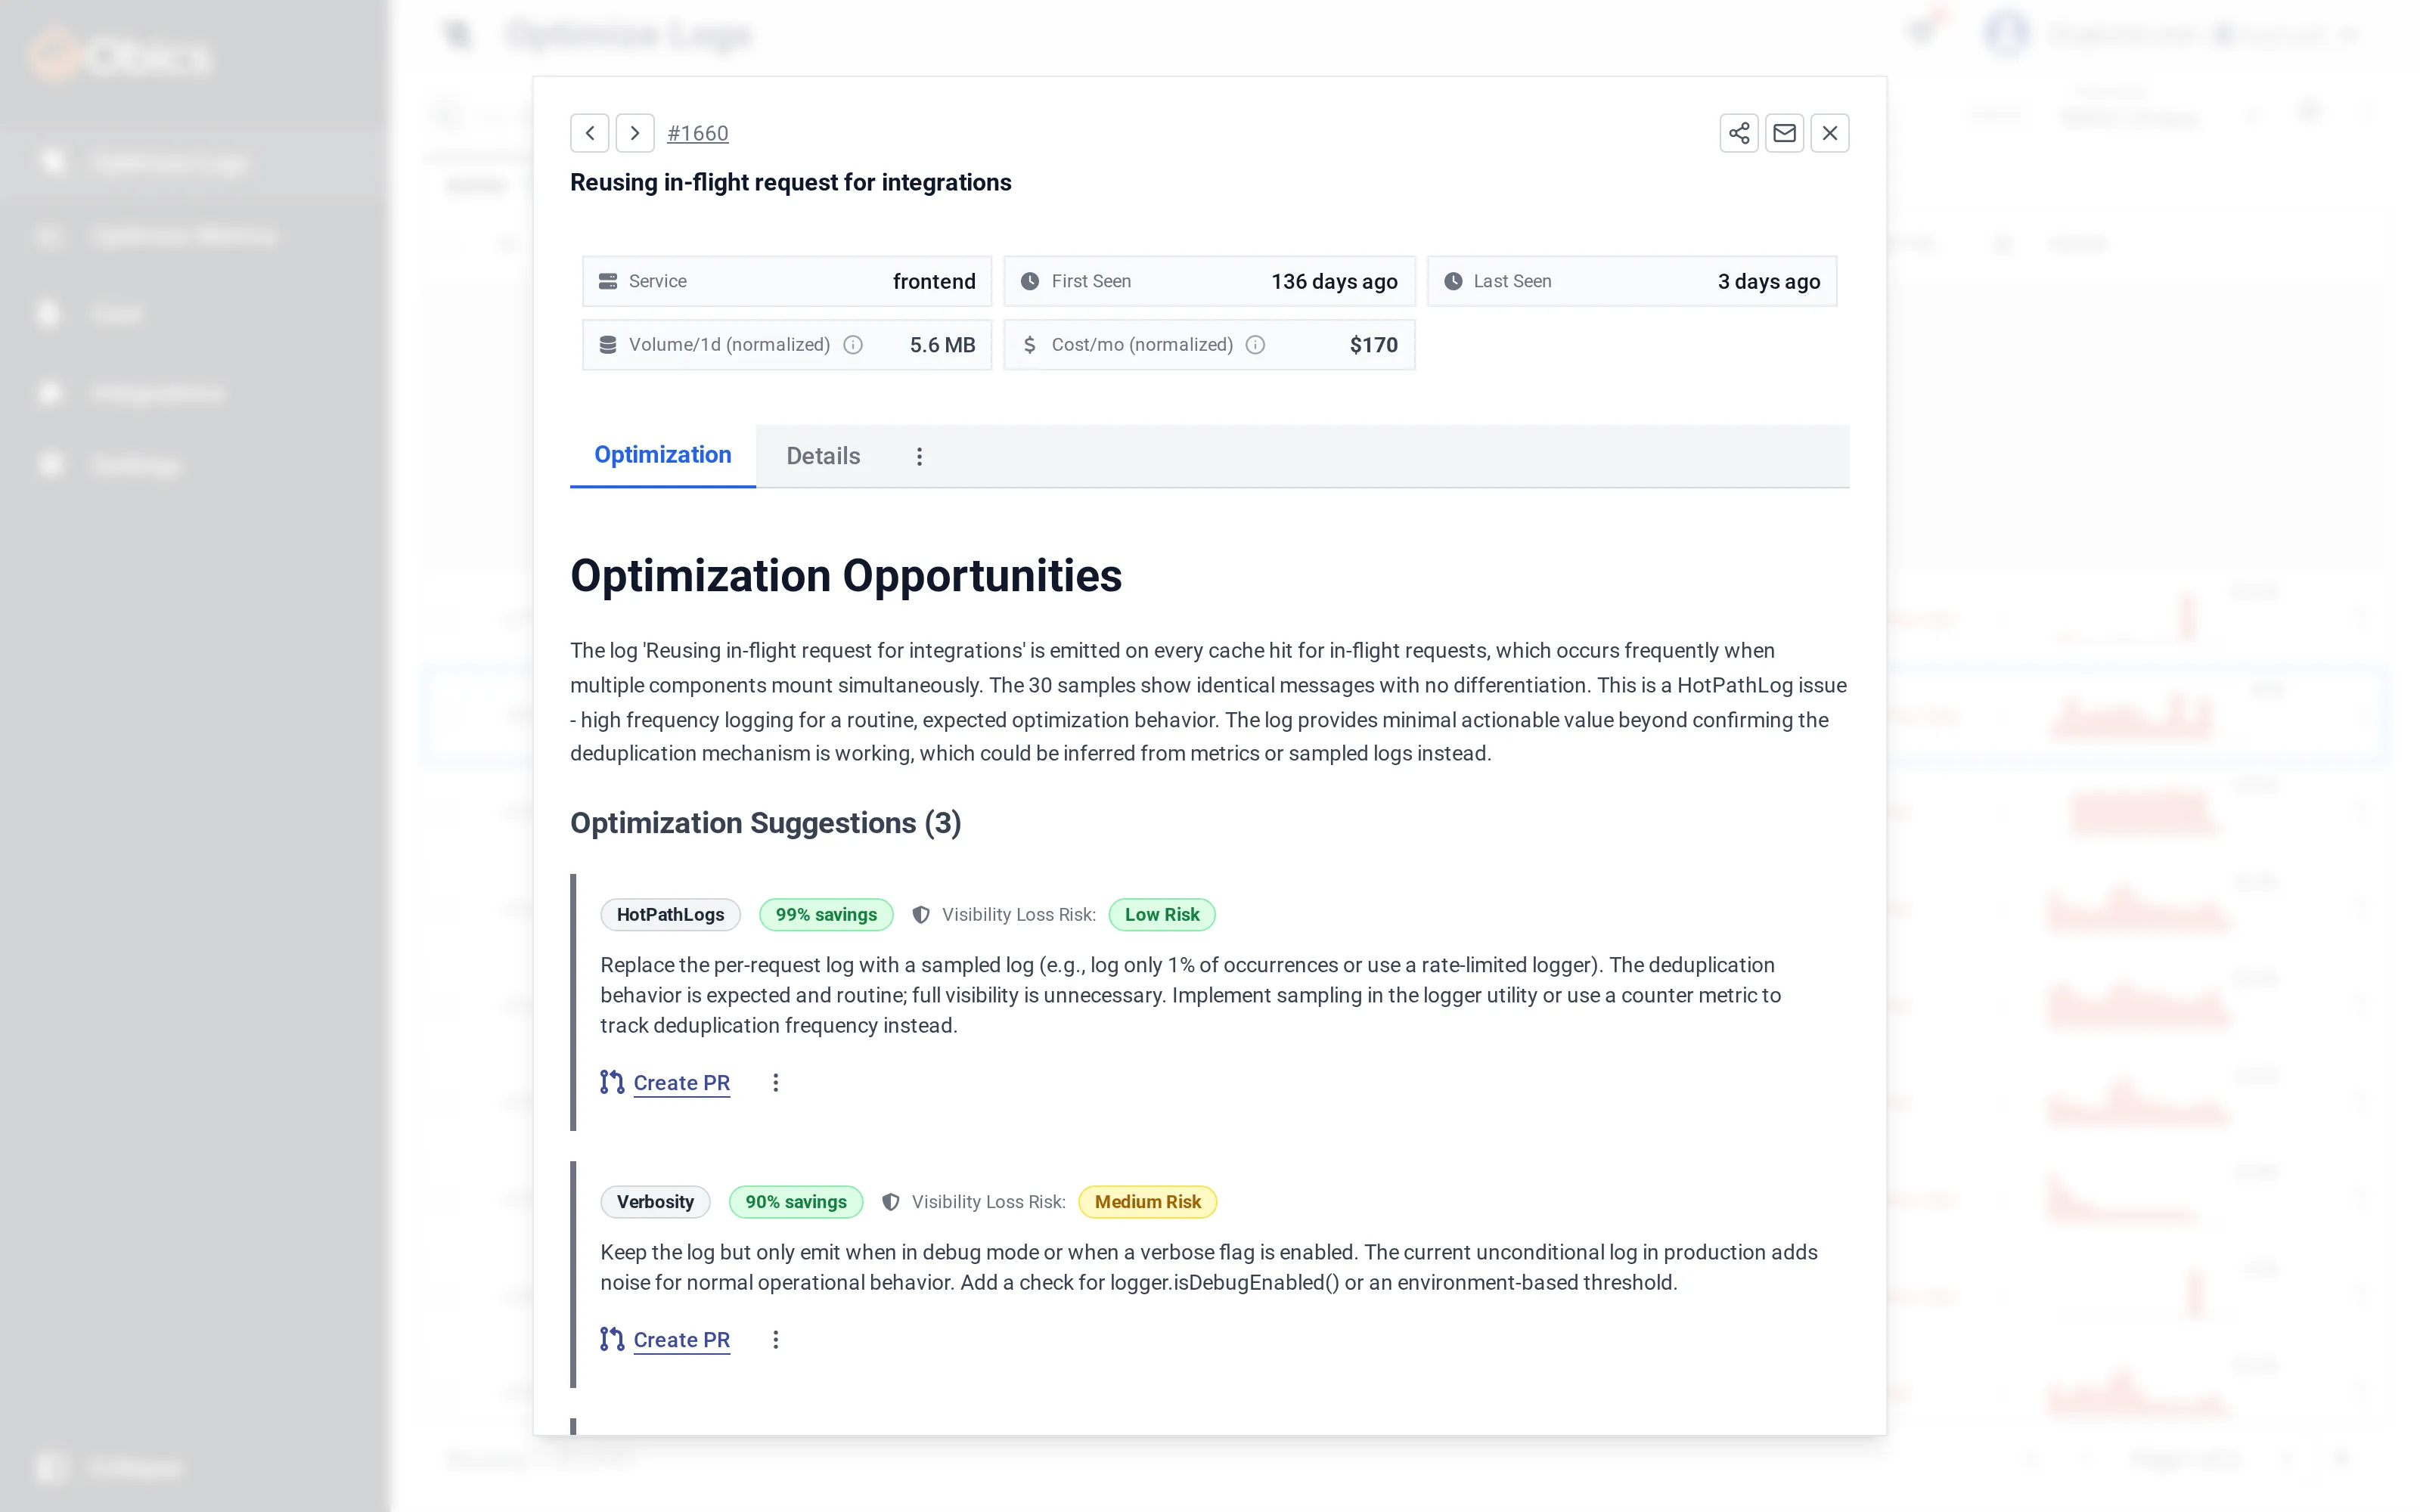
At the top is a badge grid: Service, First/Last Seen, Volume/1d, Cost/mo, and more. Below are two inner tabs:
- Optimization: an Optimization Opportunities paragraph explaining why this log is wasteful, then one card per suggestion (type, savings %, risk, the recommendation text, and action buttons). A + Add custom instruction box lets you write your own remediation.
- Details: a 30-day Trend chart, the Template, Metadata, and Log
in Code (a
file:linelink to the matched source location with a highlighted code snippet). A Drilldown section links to the log in your vendor and shows real Samples.
Arrows at the top (← / →) step through log groups without closing the popup, and the #ID / Share buttons copy a deep link.
Actions on a log group
Section titled “Actions on a log group”From a row’s ⋮ menu or the popup you can:
| Action | Effect |
|---|---|
| Open | Open the detail popup. |
| Quick Fix | Apply the top suggestion immediately and create the fix. |
| Create PR | Open a pull request for a chosen suggestion (see Applying fixes). |
| Move to ignore list / Unignore | Hide or restore the group. |
| Copy prompt | Copy an AI prompt covering the suggestions. |
| Open PR / Open Work Item | Jump to a created PR or linked ticket. |
Selecting rows with their checkboxes reveals a bulk actions bar with Ignore and Quick Fix.
Filtering
Section titled “Filtering”The top bar has a search box (free-text across log groups) and a Last seen filter (Within 1–90 days). The Ignored and Resolved tabs are all-time, so the recency filter is hidden there.