
Optimizing metrics
The Optimize Metrics page does for metrics what Optimize Logs does for logs. It lists every metric Obics discovered, how much cardinality (unique series) each one has, what it costs, and whether it’s worth keeping.
The tabs
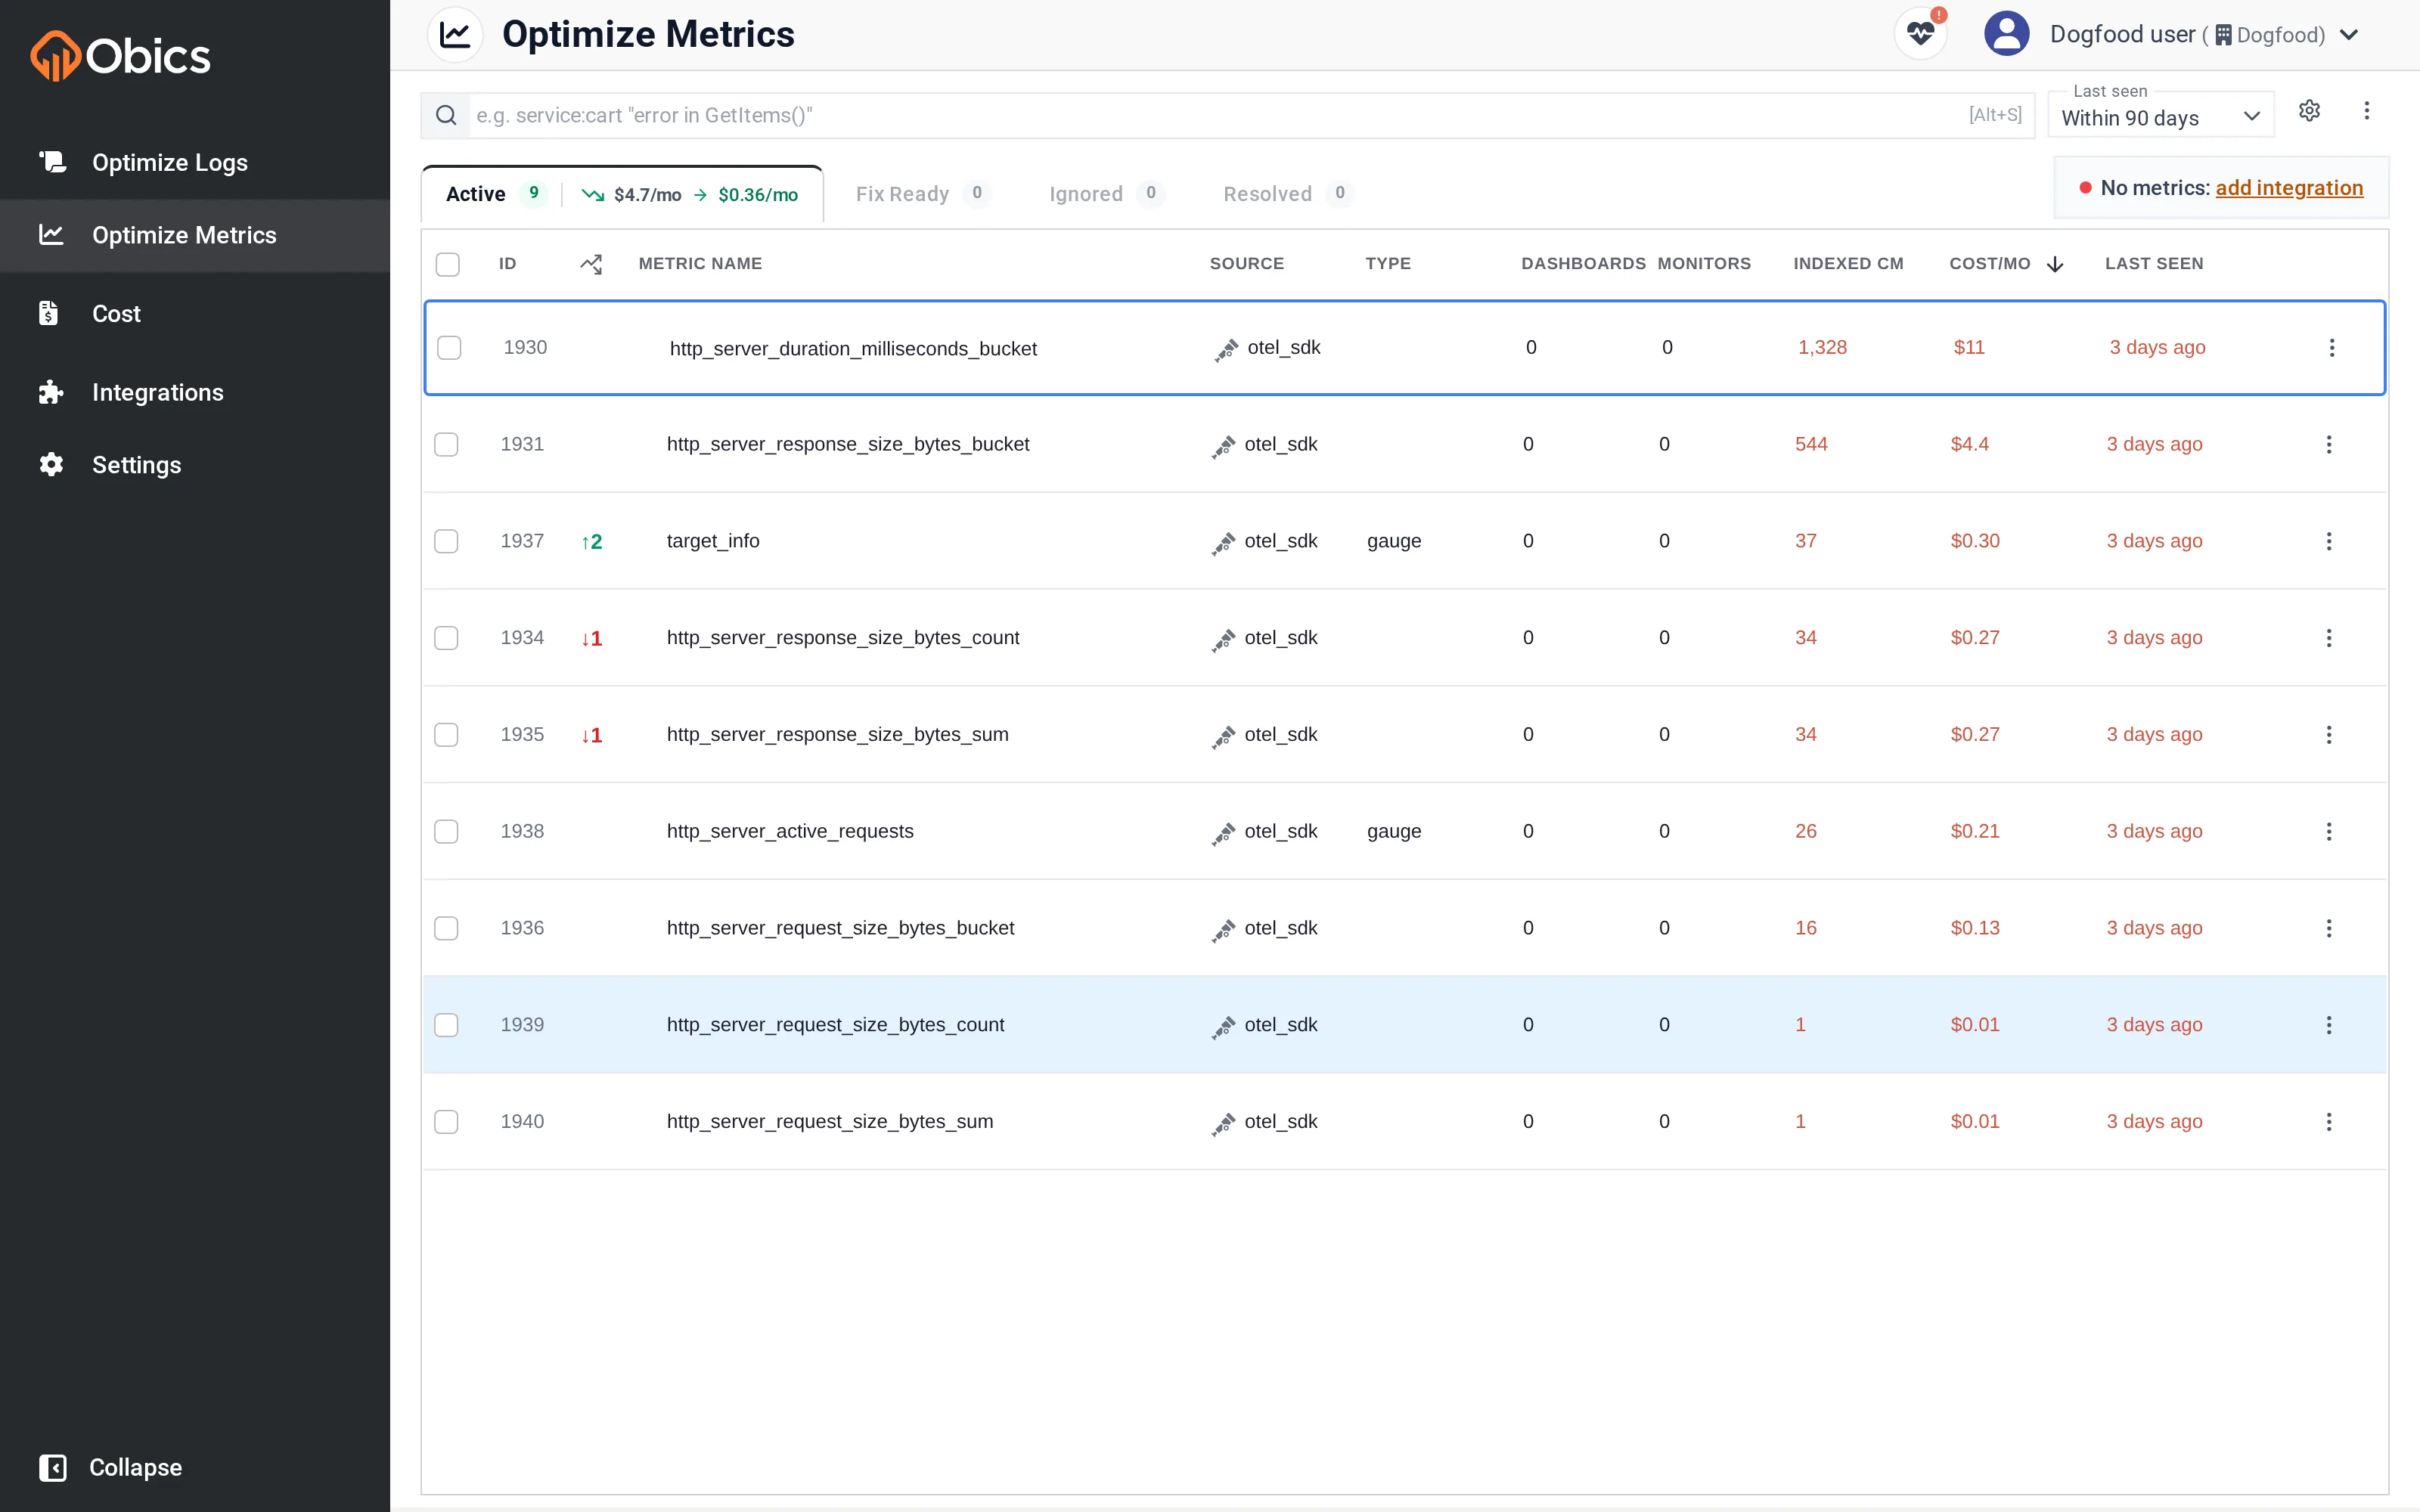
Section titled “The tabs”Same five tabs as the logs page: Active, Fix Ready, Fix Failed (only when present), Ignored, Resolved, each with a count and, where relevant, a savings badge. On the Active tab, metrics are sorted by verdict: DROP first, then REVIEW, then KEEP.
The columns
Section titled “The columns”| Column | Meaning |
|---|---|
| ID | Display ID of the recommendation. |
| Δ | Rank change versus the previous scan. |
| Metric name | The metric (for log-based metrics, the source line appears beneath it). A spike badge flags cardinality well above baseline. |
| Source | Where the metric originates: agent, logs, otel_sdk, or custom. |
| Type | gauge / count / rate / distribution, etc. |
| Dashboards | How many dashboards use it. |
| Monitors | How many monitors/alerts use it. |
| Indexed CM | Cardinality, the count vendors like Datadog bill on. |
| Cost/mo | Monthly cost (cardinality × your per-metric price). Default sort. |
| First seen / Last seen | Relative dates. |
The Dashboards and Monitors columns are important: a metric used by zero dashboards and zero monitors is a prime candidate to drop, because nothing depends on it.
The verdict and recommendation types
Section titled “The verdict and recommendation types”Each metric gets a severity verdict:
| Verdict | Meaning |
|---|---|
| DROP (red) | Strong candidate to remove or heavily reduce. |
| REVIEW (amber) | Worth a look; reducible but used somewhere. |
| KEEP (green) | Leave it alone. |
Where optimizable, a metric carries ranked suggestions whose underlying patterns are:
| Pattern | What it proposes |
|---|---|
| Unused | Nothing references this metric; stop emitting it. Savings up to 100%. |
| EquivalentExists | A redundant metric duplicating another signal (common with agent/OTel built-ins); drop all but one. |
| ExcludeTags | Remove a high-cardinality label that no dashboard or monitor uses. |
| BinTags | Bucket a high-cardinality label into fewer values instead of dropping it. |
As with logs, each suggestion shows a savings %, a Visibility Loss Risk badge, and a Side Effects badge when a vendor-side change is also needed.
The detail popup
Section titled “The detail popup”Click a metric name to open its detail.
Highlights:
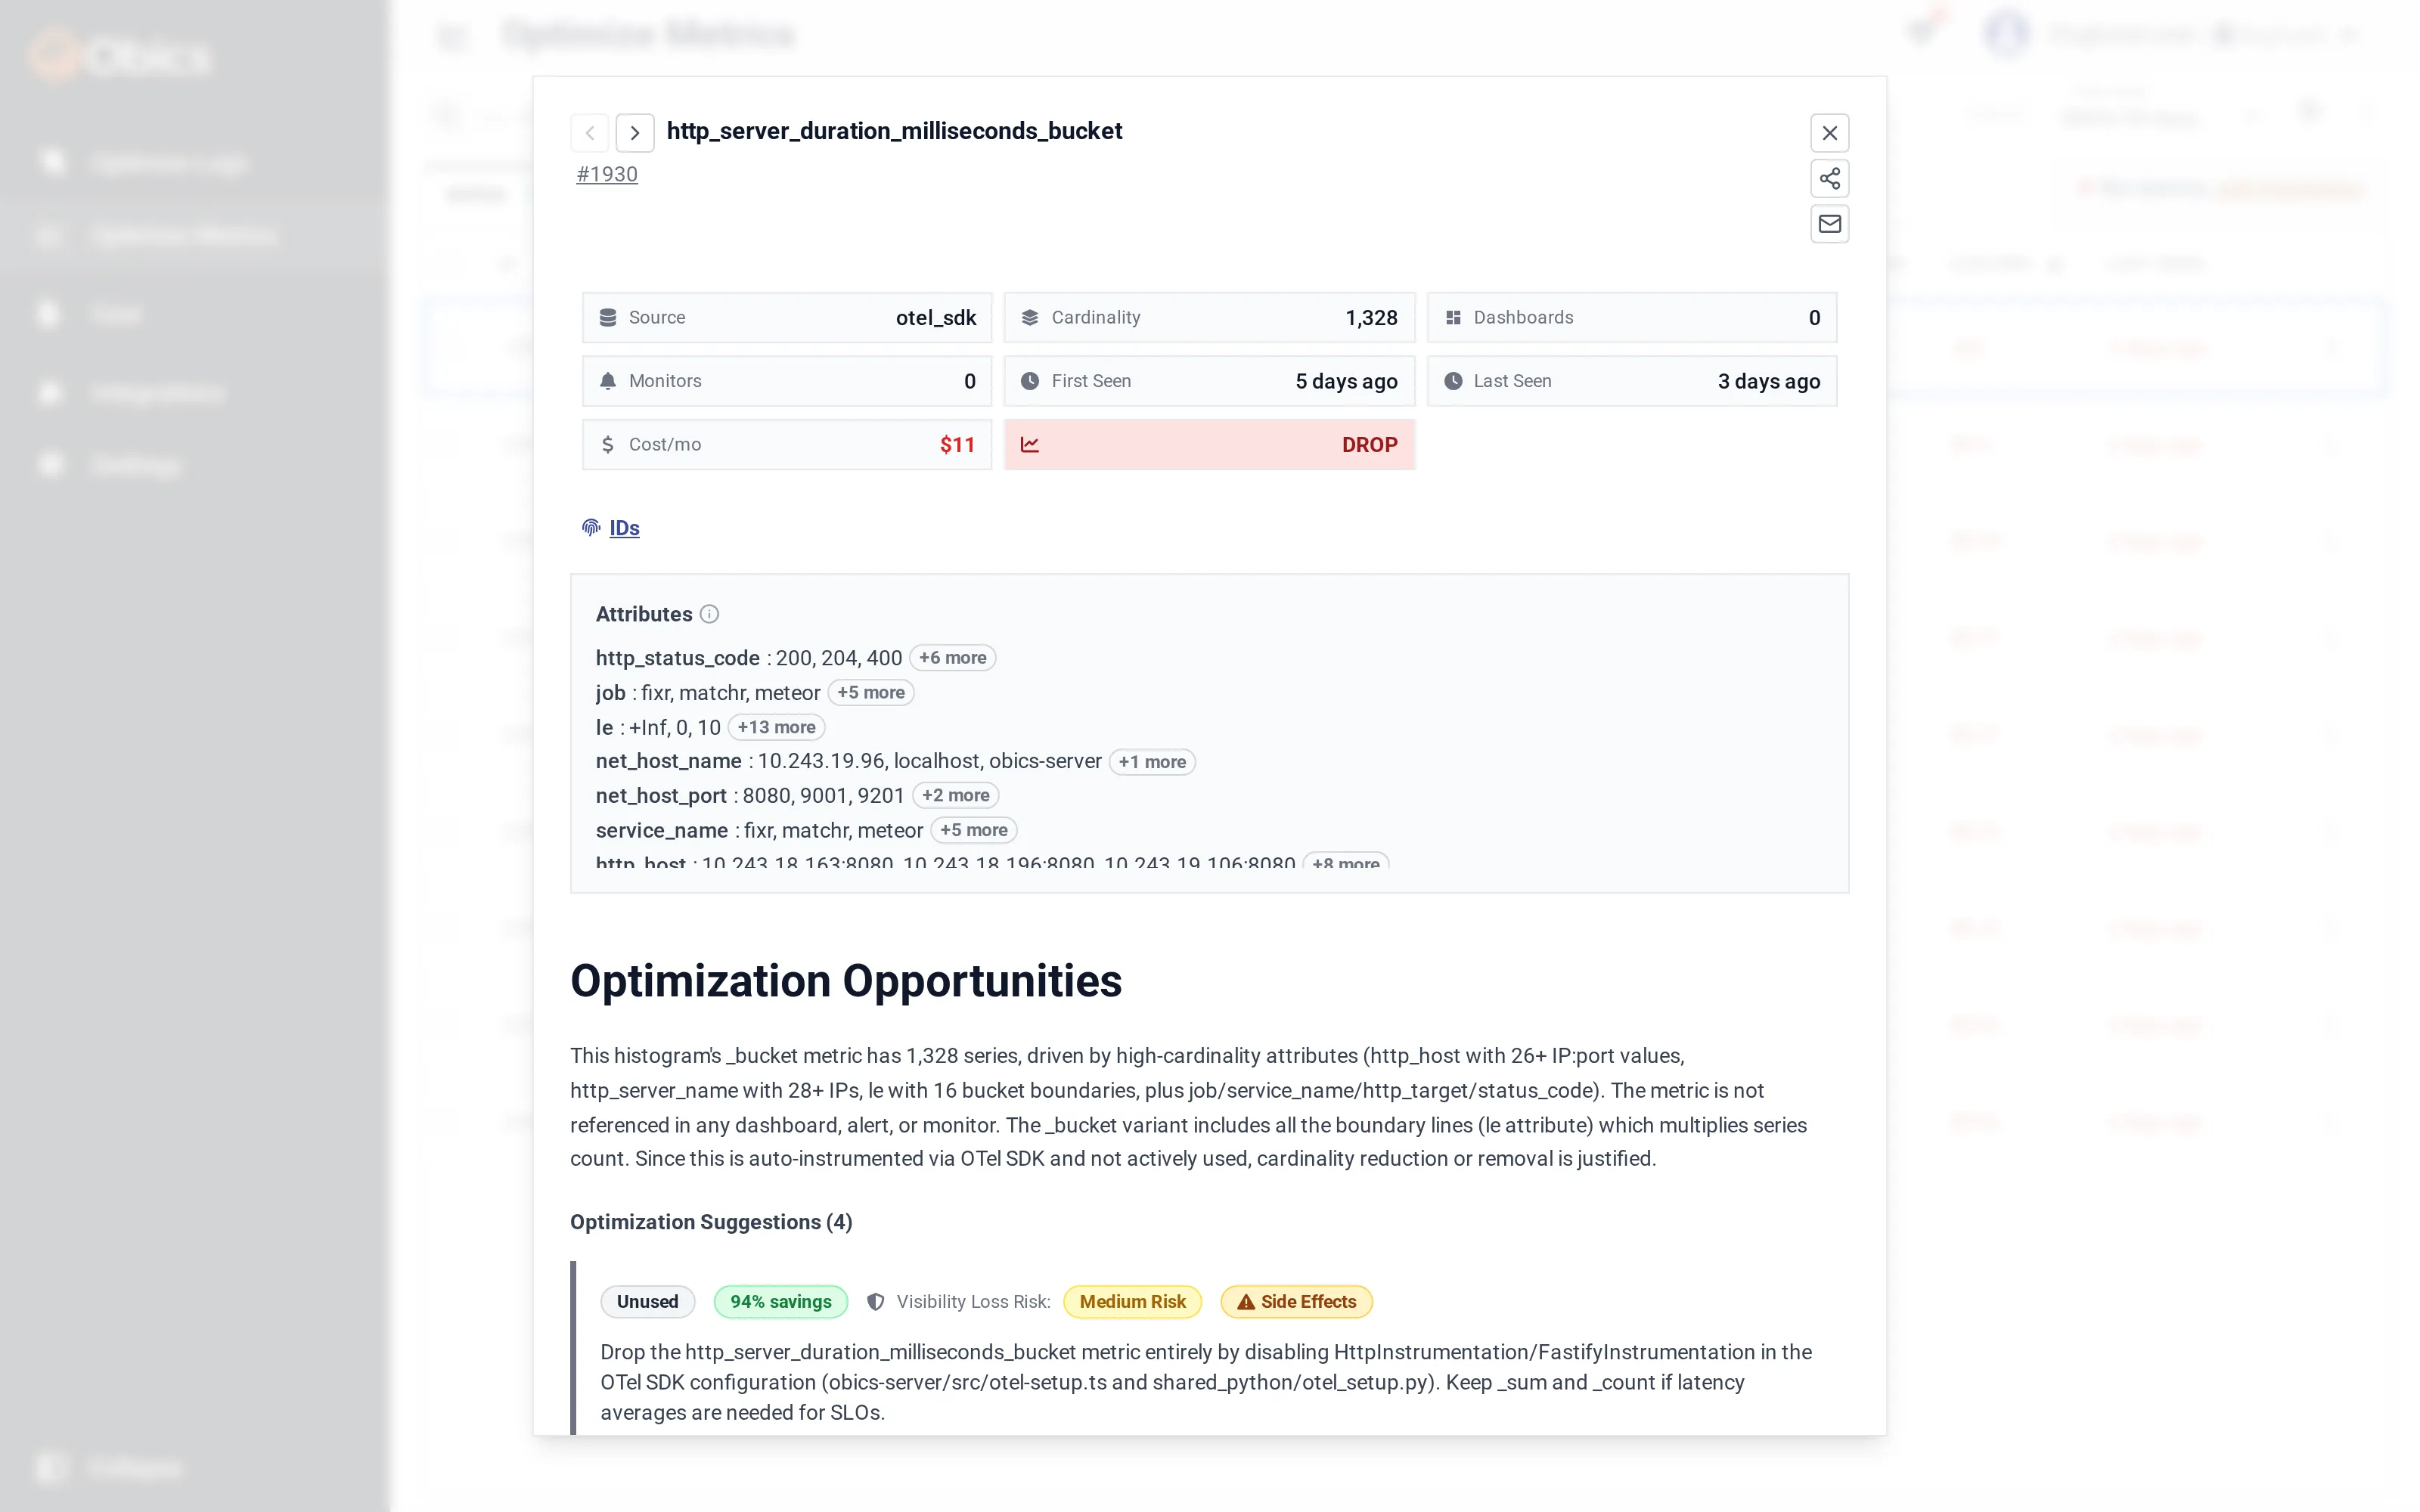
- A badge grid: Source, Cardinality, Dashboards, Monitors, Cost/mo, and the DROP / REVIEW / KEEP verdict.
- Attributes (labelled Tags for Datadog): the cardinality breakdown by label, sorted so the high-cardinality culprits float to the top, each with sample values and a +N more count. This is how you see which label is blowing up a metric’s series count.
- Metric in Code: the source location that emits the metric, when Obics can find it.
- Optimization Opportunities and the ranked suggestion cards, each with Create PR / Prepare Fix and preview actions.
Actions
Section titled “Actions”The same set as logs: Ignore / Unignore, Quick Fix (apply the top suggestion), Create PR, Resolve, and bulk actions on selected rows. Empty and in-progress states show a Queue Metrics Scan button and auto-refresh while a scan runs.