
Integrations overview
The Integrations page is where you connect Obics to your data. Open it from the sidebar. It has two sections:
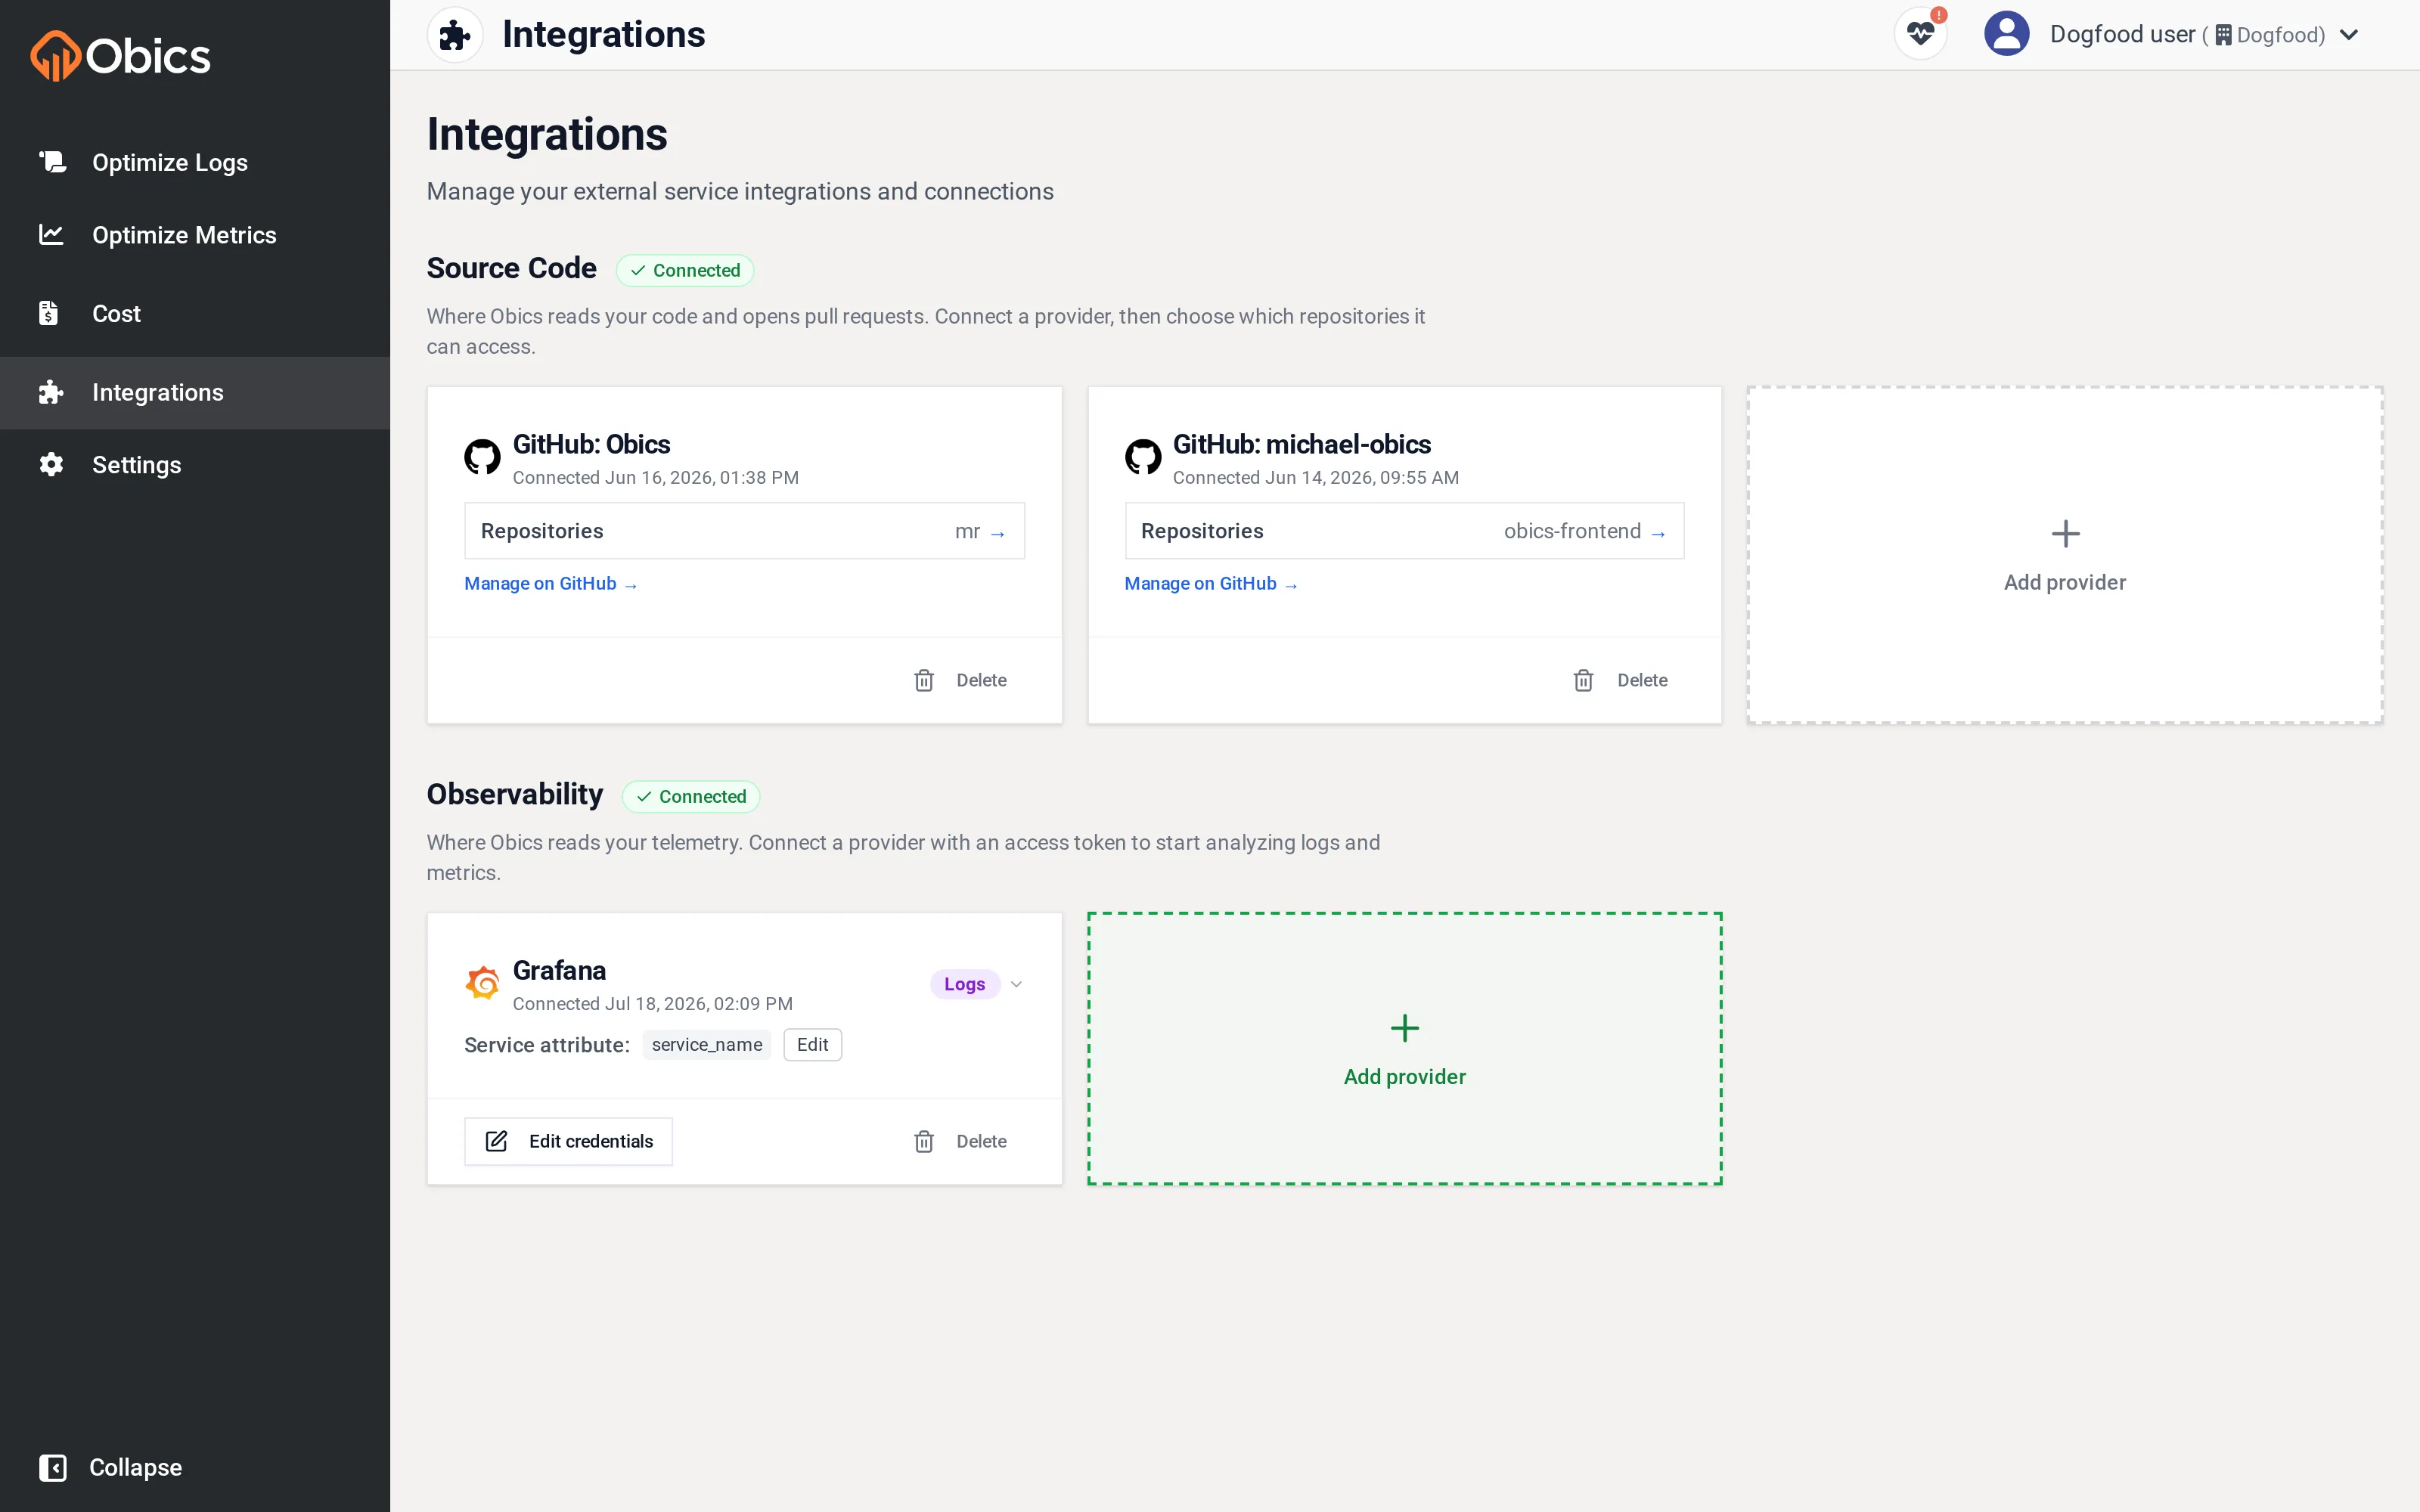
| Section | What it’s for |
|---|---|
| Source Code | Where Obics reads your code and opens pull requests. Connect a provider, then choose which repositories it can access. |
| Observability | Where Obics reads your telemetry. Connect a provider with an access token to start analyzing logs and metrics. |
Each section shows a status pill: green Connected once at least one healthy provider exists, or red Not configured otherwise.
What each connected provider looks like
Section titled “What each connected provider looks like”Every provider appears as a card with its logo, your chosen display title, and the date it was connected. Cards have footer actions such as Edit credentials and Delete (trash icon). Observability cards also show a role badge (Logs / Metrics / No role) and a Service attribute chip; source-code cards show a Repositories summary.
Adding a provider
Section titled “Adding a provider”Each section ends with a dashed Add provider card. Click it to choose from:
- Source Code: GitHub, GitLab, Azure DevOps
- Observability: Datadog, Grafana, Coralogix, CloudWatch
Then follow the provider-specific dialog. Every dialog has an Instructions link (help icon) that opens step-by-step setup guidance for that provider.
What you need to connect
Section titled “What you need to connect”To get value from Obics you need one of each:
- An observability provider: so Obics can see your telemetry and its cost. See Observability integrations.
- A source-code provider: so Obics can match telemetry to code and open fixes. See Source-code integrations.
Once both are connected, Obics can run a scan.